Few economic reports are as closely tracked as the month government job estimates. Not just does this give investors some idea of how strong the economy really is (companies won’t hire unless they expect their business to be strong in the future), but it also provides important wage growth data that is a key predictor of consumer spending that powers about 70% of the US economy.
In other words, the long-term trend in the labor market is an important fact to sustain the longest bull market in US history, and keep the S&P 500, Dow Jones Industrial Average, and Nasdaq marching higher over time.
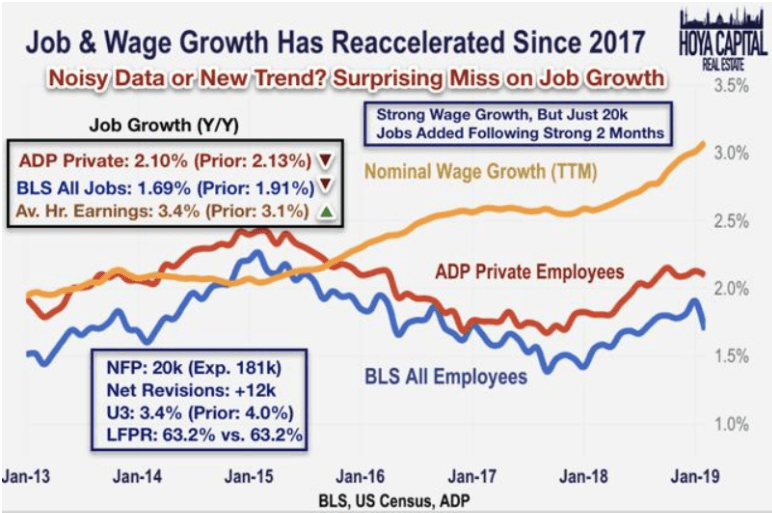
Well, the February jobs report was downright ugly, with an estimated 20,000 net jobs created last month, 90% below the 185,000 economists were expecting. But while such shockingly weak figures might cause many to fear a recession and bear market is coming soon, there are three very important facts to know before you risk making a costly mistake by selling great companies in your portfolio unnecessarily.
Initial Estimates Have Wide Margins of Error And Large Revisions Are Common
First, it’s important to understand that the monthly jobs report is actually created by two separate, and sometimes contradictory surveys.
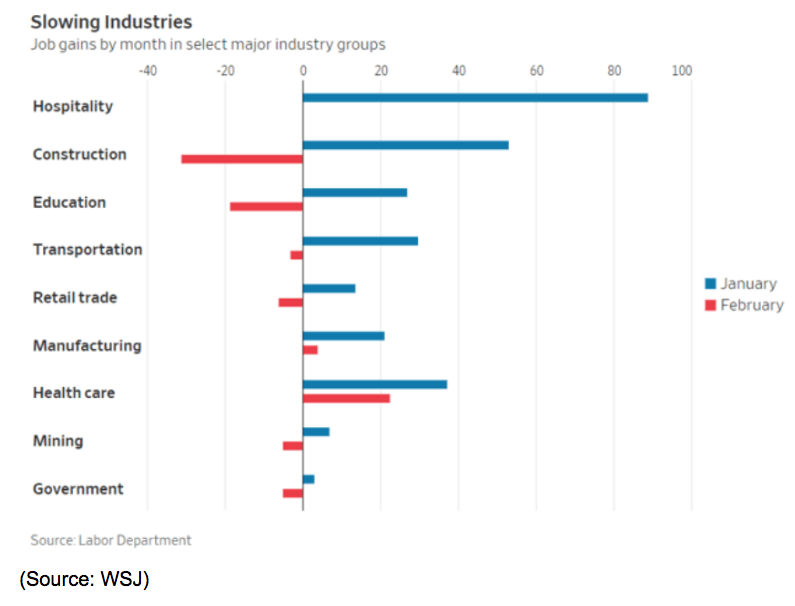
February’s first estimate (it will be revised twice in April and May) shows that certain sectors, like construction, were a big factor in February’s huge miss. Construction is a volatile sector and many economists think that poor winter weather (especially in the Midwest), combined with possible effects from January’s government shutdown, might have impacted it.
But even more important is to understand that while the headline figure of 20,000 net jobs created might give the idea of precision, in reality, the government’s estimate has enormous margins of error of about 150,000.
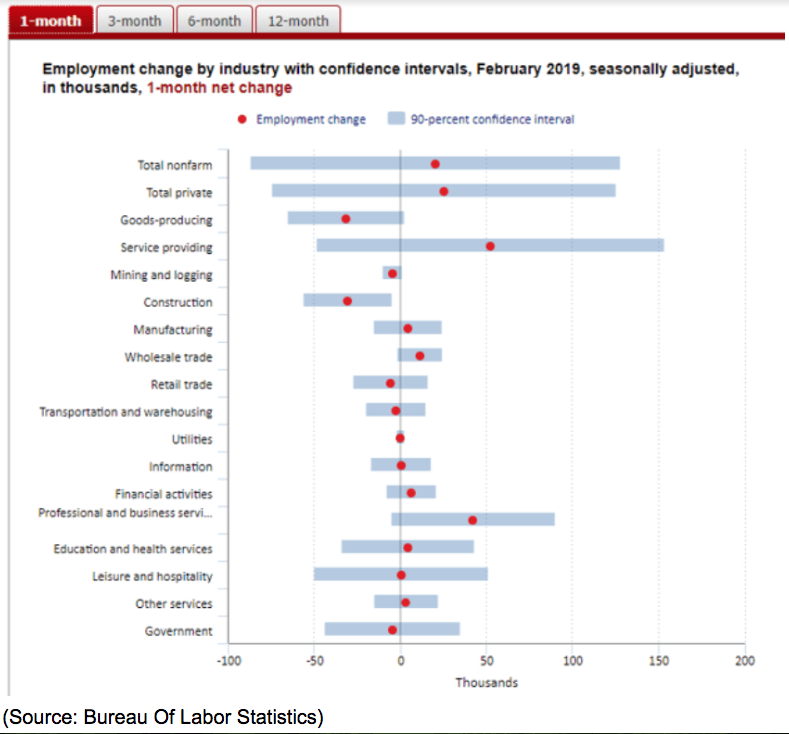
This explains why month to month, you sometimes see large revisions in the jobs estimate.
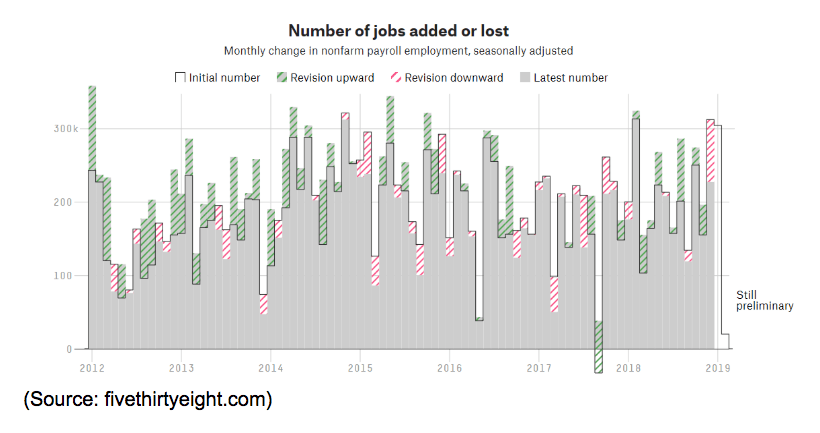
For example, in late 2017 it appeared we had our first month of jobs losses in six years, yet that figure was later revised upwards significantly. December’s 312K blowout was revised down 85,000, and it’s very possible that February’s figure will rise much higher in the next two months.
But here’s an even bigger reason to not panic over February’s apparently horrible jobs estimates. That would be how the government attempts to make its seasonal adjustments, which usually mean the first quarter is the weakest when it comes to job creation.
Very Weak Reports Are Common Early in the Year
The economy will naturally be cyclical when it comes to job creation, affected by things like the Christmas holiday rush (for retailers and shippers) and extra construction jobs in the spring, as housing construction picks up. Thus the government attempts to smooth out its estimates including by what is called the “death/birth model.”
In other words, the government will not just go by its survey data when attempting to estimate how many jobs are created or destroyed, but also somewhat arbitrarily make up figures to account for business creation/destruction it believes its surveys don’t capture.
Typically in the spring and early summer, this adjustment is very high to the upside, but in January through March, it tends to be negative. This means that February’s low figure, which again, might be revised much higher next month, is likely being hurt by what might be an excessively bearish estimate by the Bureau of Labor Statistics.
But later on, we’re likely to see much higher job creation, thanks to the fact that in the spring the government’s guesstimated seasonal adjustments tend to be very large. For example in 2018 here were the adjustments the BLS made based on the birth/death model.
April: + 275K
May: +215K
June: +112K
July: +171K
Does this mean that the entire jobs report is made up and useless? No, but it does mean you need to use the longer-term trend, such as the three-month rolling average which is currently 186,000. That’s smaller than the 223,000 average we saw in 2018, but well above the 145,000 per month the Wall Street Journal estimates is needed to keep employment stable over time.
In other words, as long as the three month rolling average is over 145K, the labor market will continue to tighten and help drive stronger wage growth, and by extension, consumer spending that is the lifeblood of the US economy.
And speaking of wage growth, there the news continues to be nothing but good.
Strong Wage Growth Is Still Worth Celebrating
Thanks to U6 unemployment (the more accurate metric than the headline U3 figure), falling to 7.3% in February (from 8.1% in January), wage growth last month was the strongest in 12 years, 3.4% YOY. Better yet, the non-supervisory figure (which applies to 80% of workers) was 3.5%.
In a healthy economy, you typically see 3.5% to 4% wage growth, and we’re basically getting back to the low end of normal now. But again, it’s the long-term trend that’s the most meaningful, given that all survey-based data has some volatility and margin of error.
Wage growth, like all economic metrics, can be messy in the short-term, but the trend has generally been trending higher over time. But lest you worry that this might stoke inflation, don’t fret because there is still plenty of slack in the labor market.
For one thing, adjusted for inflation, last month’s real wage growth was 1.9%, the fastest growth rate since 2015. Second, assuming the three-month rolling average rate of net job creation continues it would take about five years longer before a tight job market would likely start pushing up inflation, and force the Fed to hike rates further.
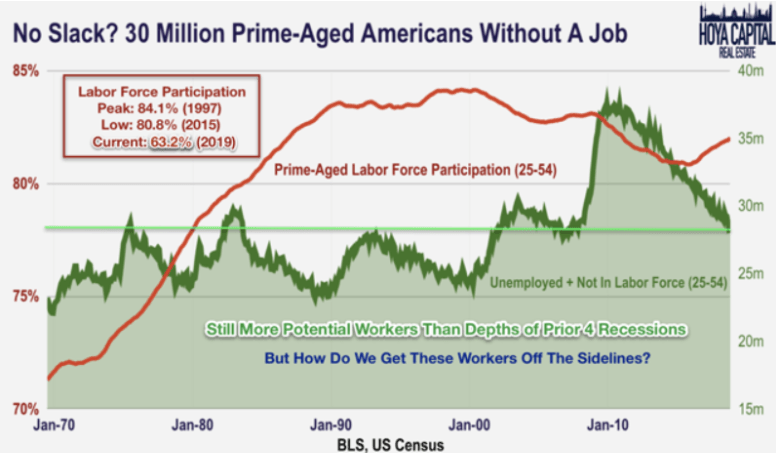
That’s how long it would take before the finally rising prime-age labor participation rate would return to its previous peak set back in 1997.
In other words, due to the severity of the Great Recession, the very slow pace of recovery has taken about 10 years to get us back to a historically normal labor market. This means that we’re not likely facing the kind of economic overheating factors that you typically see at the end of the economic cycle, such as 4+% wage growth, inflation over 2.5%, and the Fed hiking the fed fund rate above 5%.
Instead, we see continued strong wage growth and a US consumer that remains highly confident about the future.
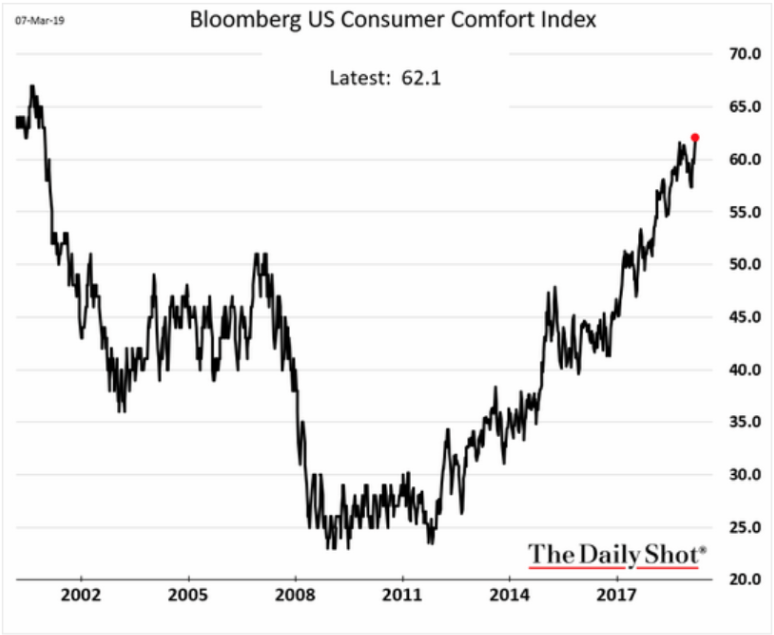
The Bloomberg Consumer Comfort Index is based on a survey of US consumer personal finances and willingness to spend. It’s been conducted by ABC news since 1985 and as you can see the trend has been strongly higher since wage growth bottomed in the early part of the decade.
As long as February’s weak numbers don’t persist through the rest of the year (as I expect they won’t) then Main Street should continue to thrive, consumers will keep spending, and we should avoid a recession.
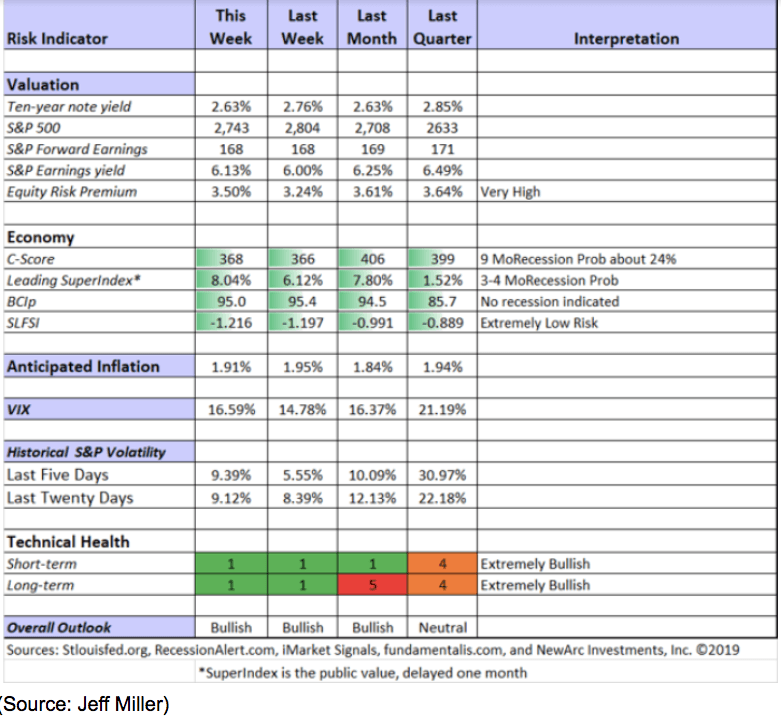
In fact, based on Jeff Miller’s meta-analysis of various economic indicators, the probability of a recession starting this year is about 24%, while the risks of a recession starting within four months is under 10% (though up significantly in recent months).
Basically, we’re indeed looking at much slower growth in 2019 than last year, partially self-inflicted via the idiotic shutdown and ill-conceived trade war. But for now, things are still getting better and positive growth is not the same as negative growth, which is what you should actually be worried about (not all bear markets cause recessions but all recessions lead to bear markets).
Bottom Line: One Horrible Month Does Change the Overall Strong Jobs Trend, Nor Portend a Recession in 2019
Don’t get me wrong, I too am worried about slowing economic fundamentals and how that might weaken earnings growth to the point of slamming the stock market. That’s why I track the economic macro outlook on a daily basis through various economic reports.
But it’s important to remember that economic reports are packed with uncertainty because of how they are generated (lots of surveys with large margins of error), and often include season adjustments that are educated guesstimates at best.
Both are true of the official monthly jobs report, whose margin of error is 150,000 AND whose seasonal adjustments tend to be extremely biased to the downside early in the year, but very positive in the spring and summer.
This means it’s much too early to start worrying about a recession in 2019, which remains a low probability event. What’s more, the strongest wage growth in 12 years and steep decline in U6 unemployment still points to a healthy labor market, with thriving consumers who are likely to keep spending freely and help push off any economic downturn to 2020 or 2021.
While it’s always a good idea to worry about risks to your portfolio, it’s proper asset allocation, not market timing, that is your best bet to protect your retirement nestegg during a future bear market.
What should you do with your portfolio? Well, that depends on your individual needs, time horizon and risk tolerance. Personally, I remain 100% invested in stocks though I am gradually shifting my money into low-risk, ultra high-quality blue-chips, such as those that make up my new Bunker Dividend Growth Portfolio.
About the Author: Adam Galas

Adam has spent years as a writer for The Motley Fool, Simply Safe Dividends, Seeking Alpha, and Dividend Sensei. His goal is to help people learn how to harness the power of dividend growth investing. Learn more about Adam’s background, along with links to his most recent articles. More...
9 "Must Own" Growth Stocks For 2019
Get Free Updates
Join thousands of investors who get the latest news, insights and top rated picks from StockNews.com!
Top Stories on StockNews.com

Investor Alert: Healthy Pause for Stock Market
This recent pullback very much looks like a “healthy pause” for the stock market as the S&P 500 (SPY) comes off recent highs. What is the cause of the pause? How long will it last? What happens afterwards? And how to make money in this market? Steve Reitmeister will answer all these questions and more in his latest market commentary below...
Best & Worst Performing Stock Industries for April 19, 2024
Led by ticker KGJI, "Fashion & Luxury" was our best performing stock industry of the day, with a 1,298.85% gain.
Best & Worst Performing Mid Cap Stocks for April 19, 2024
ISMAY leads the way today as the best performing mid cap stock, closing up 21.21%.
Best & Worst Performing Small Cap Stocks for April 19, 2024
KGJI leads the way today as the best performing small cap stock, closing up 100,000.00%.