In addition to the ramifications that the decline in oil might be indicative of a slowdown in global growth, it also might have a ripple effect through the financial system.
As I discussed here previously, nearly 20% of the high yield bond market is tied to the capital-intensive energy sector. If some of those borrowers begin to default it will weigh on the banks which in turn could tighten up overall lending.
This comes just as interest rates are rising and Fed Chairman Jerome Powell recently raised red flags of concern over the level and leverage of corporate bond market. Worries of a domino effect of defaults are growing.
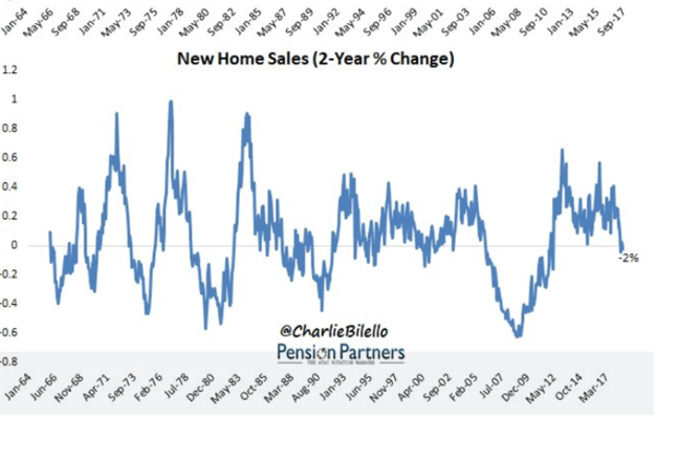
Turning to the charts, we can see the current decline is the equivalent to not only the late September 2015/early 2016 but rather, it began a year prior when the market rolled over in the summer of 2014 and gave us a panic low in October 2014.
What followed was an 18-month period of sideways actions within a 300 point range. August and October 2015 did not take out the October 2014 low, but the early 2016 swan dives came right down to it.
Source: stockcharts.com
Continue reading on the next page…
About the Author: Steve Smith

Steve has more than 30 years of investment experience with an expertise in options trading. He’s written for TheStreet.com, Minyanville and currently for Option Sensei. Learn more about Steve’s background, along with links to his most recent articles. More...
9 "Must Own" Growth Stocks For 2019
Get Free Updates
Join thousands of investors who get the latest news, insights and top rated picks from StockNews.com!
Top Stories on StockNews.com
Is Goldman Sachs (GS) Q1 Performance a Green Light for Investors?
The Goldman Sachs Group (GS) comfortably topped analysts’ earnings and revenue estimates in the first quarter. After its solid first-quarter performance, should investors consider adding the stock to their portfolio now? Keep reading...
Best & Worst Performing Stock Industries for April 18, 2024
Led by ticker KGJI, "Fashion & Luxury" was our best performing stock industry of the day, with a 1,298.79% gain.
Best & Worst Performing Small Cap Stocks for April 18, 2024
KGJI leads the way today as the best performing small cap stock, closing up 100,000.00%.
Best & Worst Performing Large Cap Stocks for April 18, 2024
UAL leads the way today as the best performing large cap stock, closing up 17.45%.