

- Schlumberger (SLB) makes a significant percentage comeback since the March low
- Halliburton (HAL) does even better as it works to fill its gap
- OIH diversifies risk in the oil services sector
Energy-related stocks lagged both the stock market and the price of crude oil and natural gas for years. The price action in the shares turned out to be a sign for the commodity. In March, the price of natural gas fell to its lowest level since 1995. In April, nearby crude oil futures fell below zero for the first time.
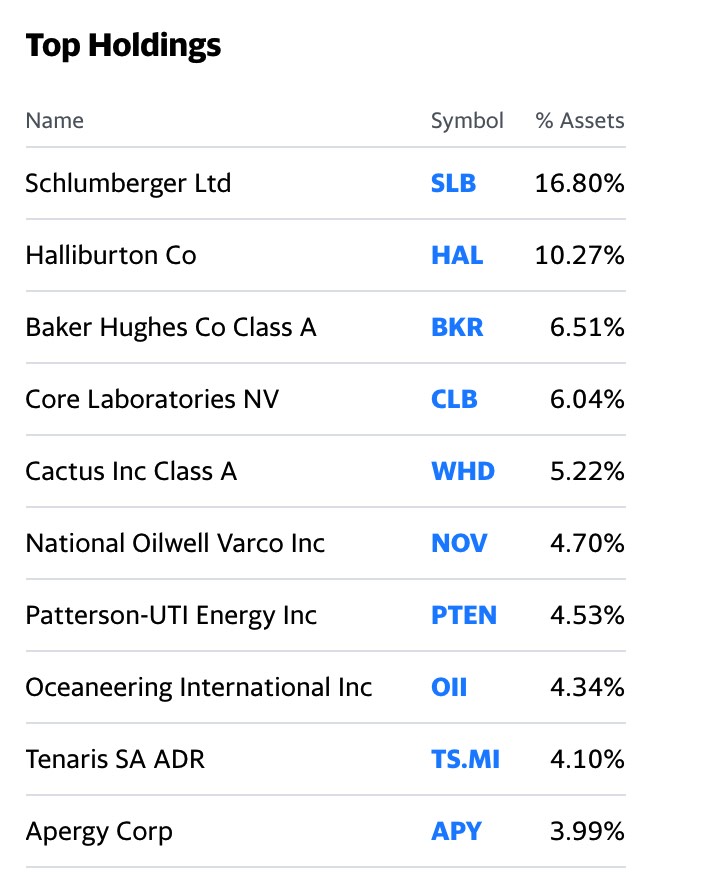
Within the energy sector, shares of oil services companies have been falling steadily since 2014. The VanEck Vectors Oil Services ETF (OIH) product holds a portfolio of the top companies in the business of providing critical support for energy exploration, production, refining, and logistics. The ETF has an over 27% exposure to Schlumberger Limited (SLB) and Halliburton Company (HAL), the two leaders in the sector. The OIH ETF fell below its all-time low in 2019 and kept on falling. The bearish price action caused a one for twenty reverse split on April 15, 2020. The ETF has made a comeback since the March low. However, it is nowhere near the price at the end of 2019. SLB and HAL remain the redheaded stepchildren of the energy sector. After the recovery in the price of crude oil from the April low, the ETF was still significantly lower than the price at the start of 2020.
Schlumberger (SLB) makes a significant percentage comeback since the March low
In March 2020, SLB shares fell to a low of $11.87, the lowest in three decades, since 1990.
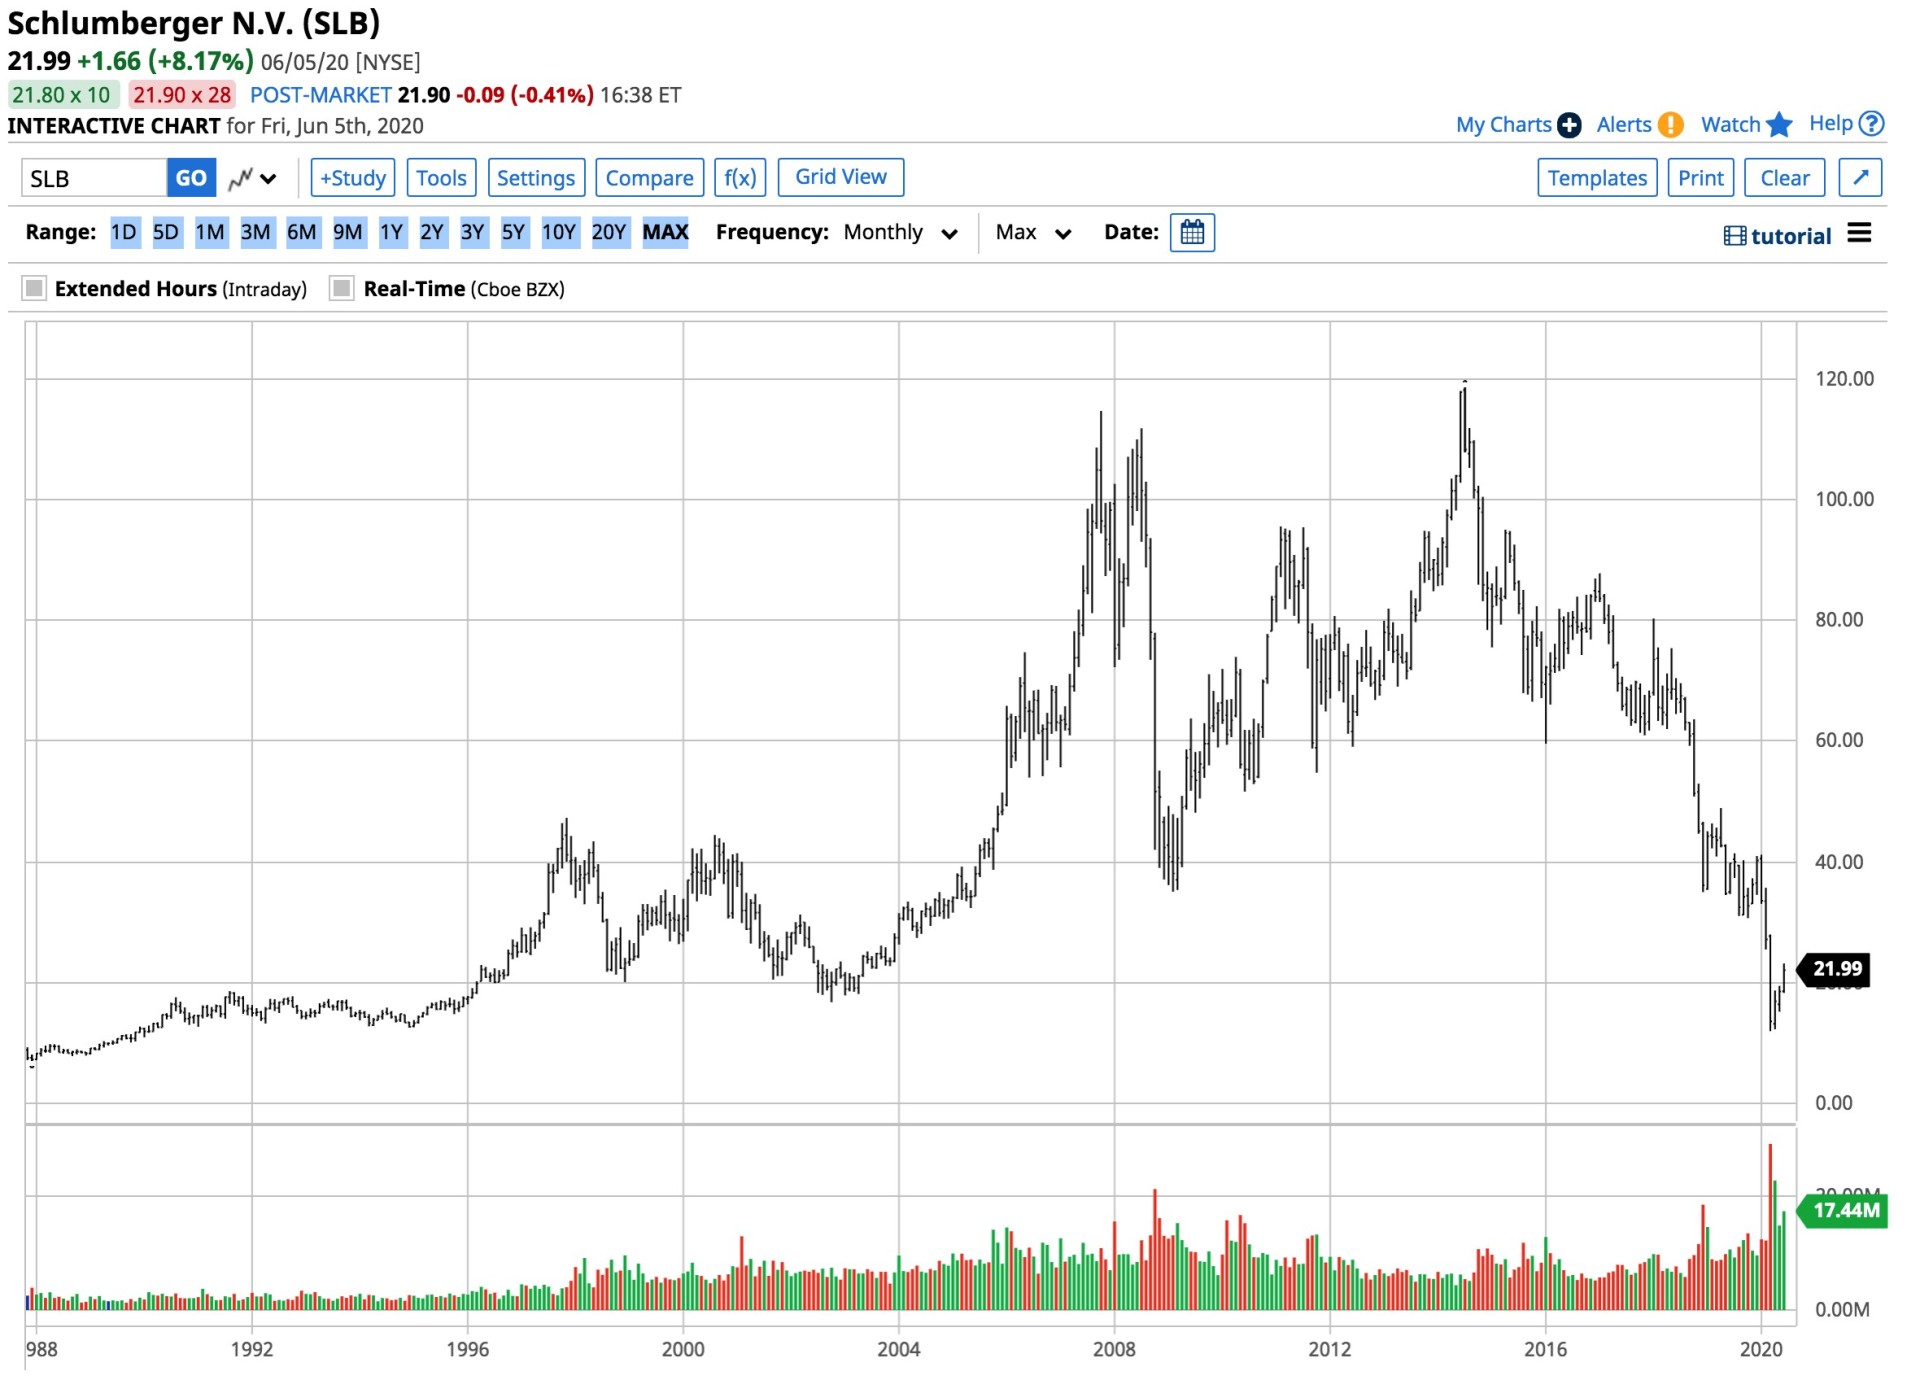
Source: Barchart
At $21.99 at the end of last week, SLB shares were over 85% higher since the March low. The shares traded to an all-time high of $118.76 in 2018.
SLB has a market cap of just over $30.5 billion and trades an average of over 22.2 million shares each day. The company was paying shareholders a 2.3% dividend, which could be in jeopardy in the current environment.
Source: Barchart
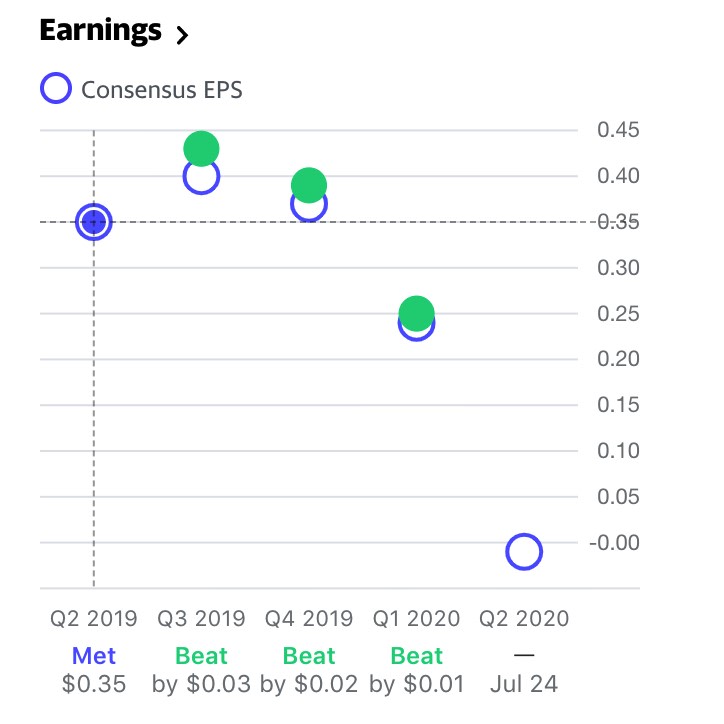
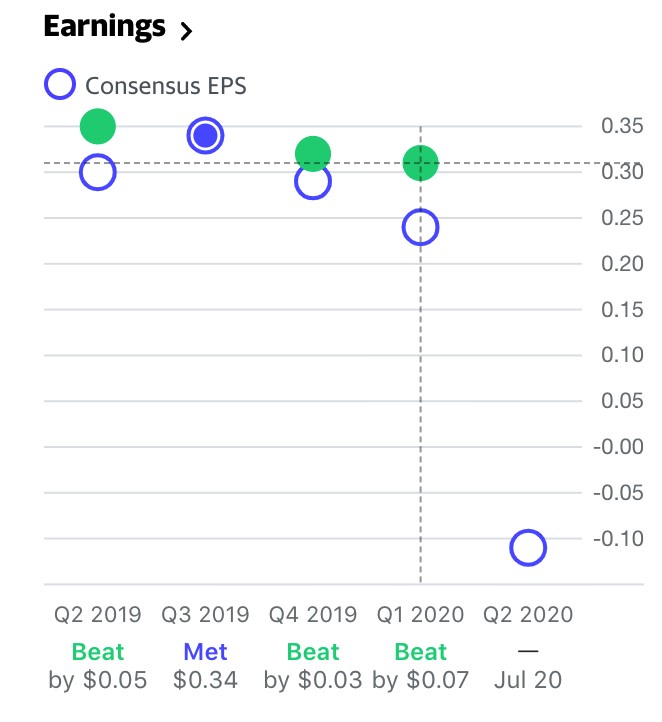
Meanwhile, SLB has a consistent record of earnings. While analysts expect a loss in Q2, SLB has posted profits over the past four consecutive quarters.
Source: Barchart
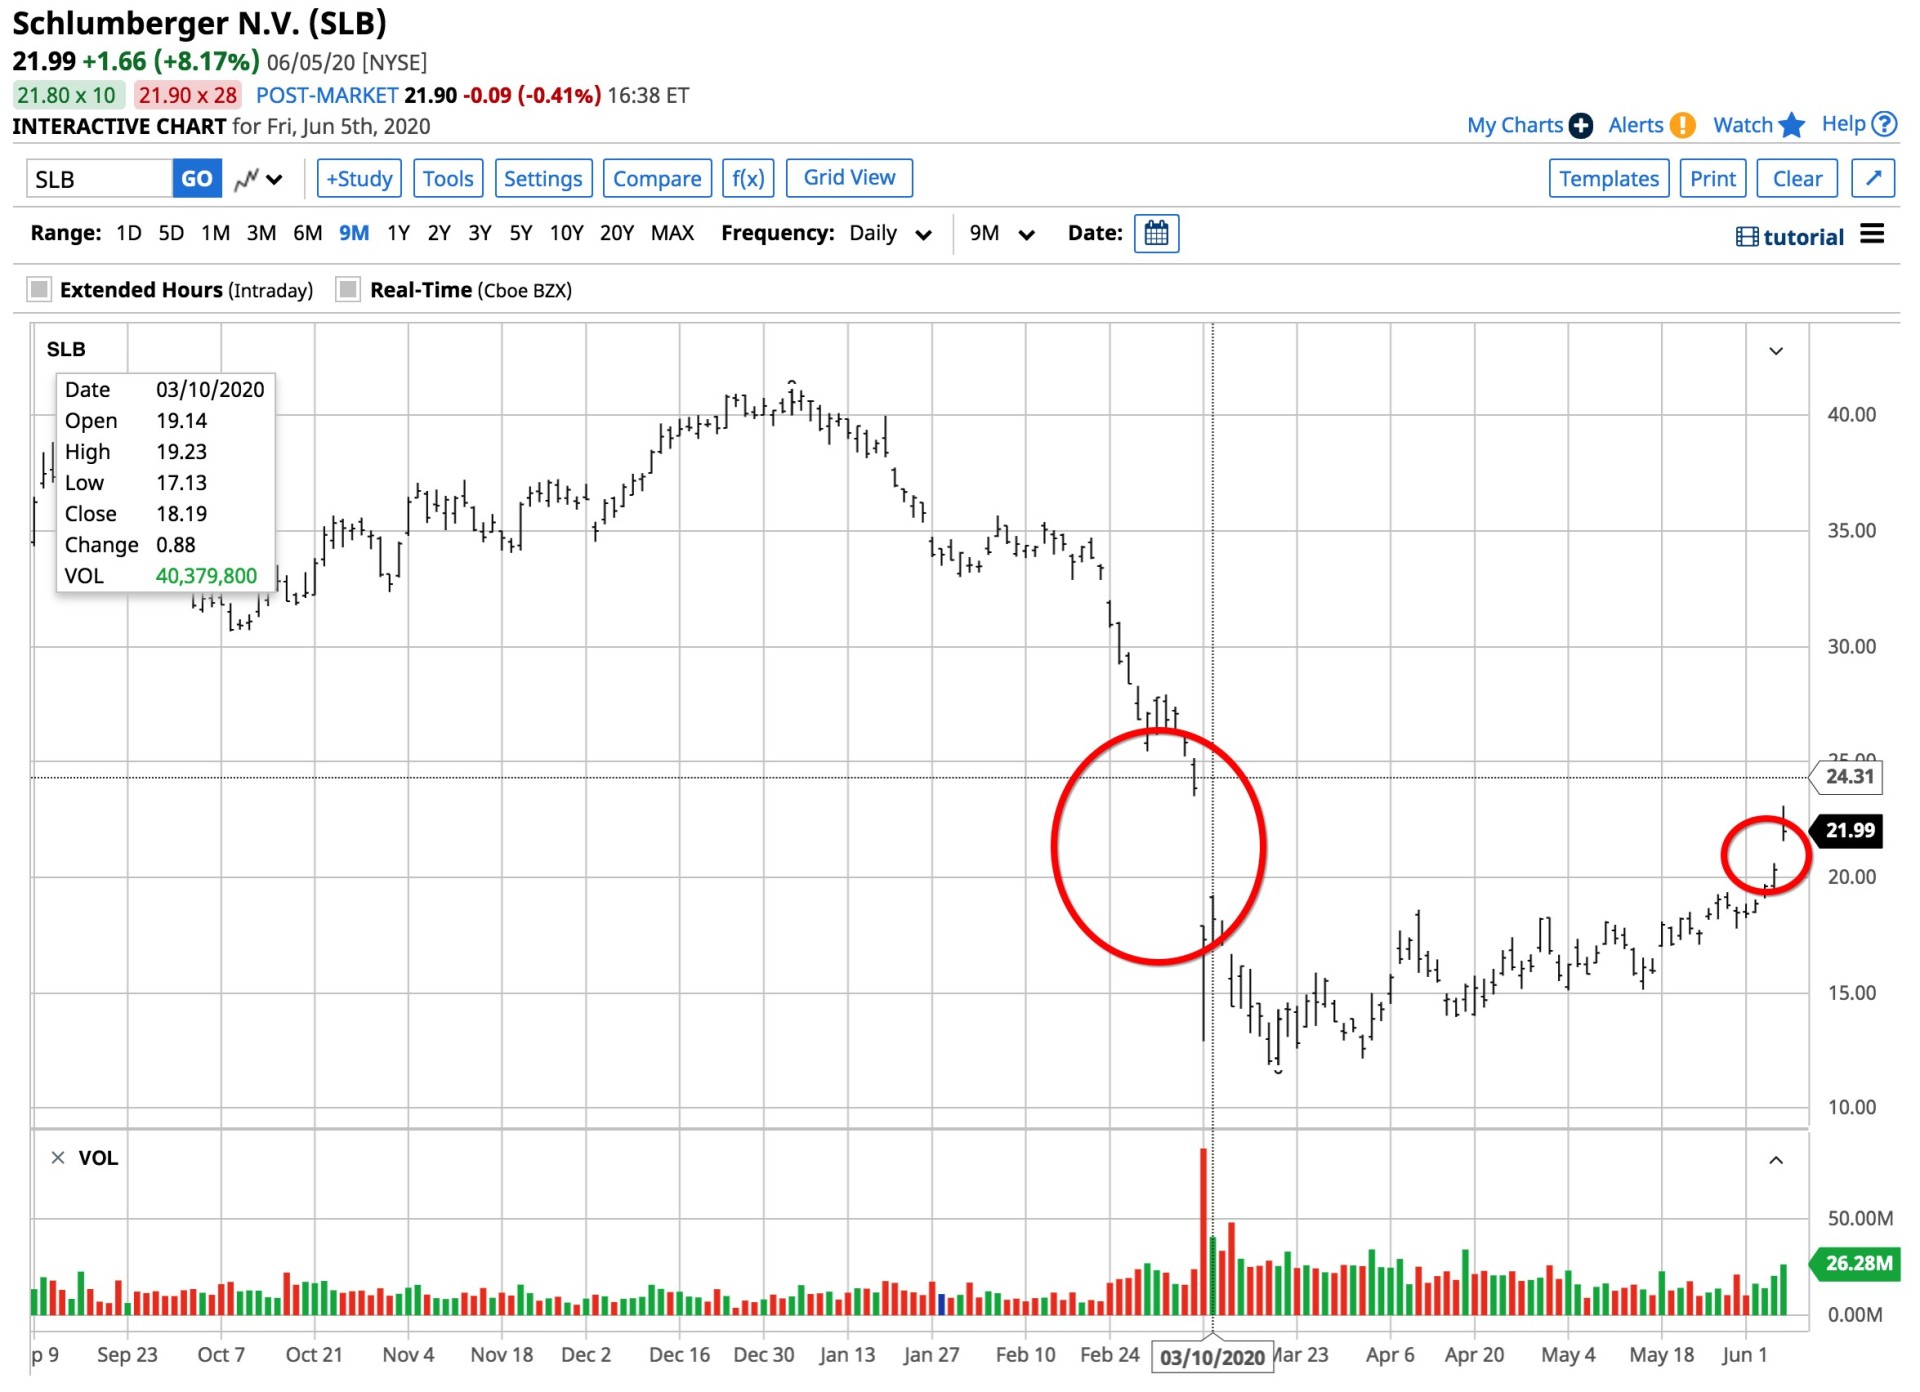
The chart shows that the price carnage in markets in March created a gap on the chart from $19.23 to $23.52 per share. Price action tends to fill voids on charts over time. The gap was acting as a magnet for SLB shares at the end of last week. SLB created another void on the chart from June 4-5 from $20.61 to $21.57, which could create an island reversal if the stock continues to climb.
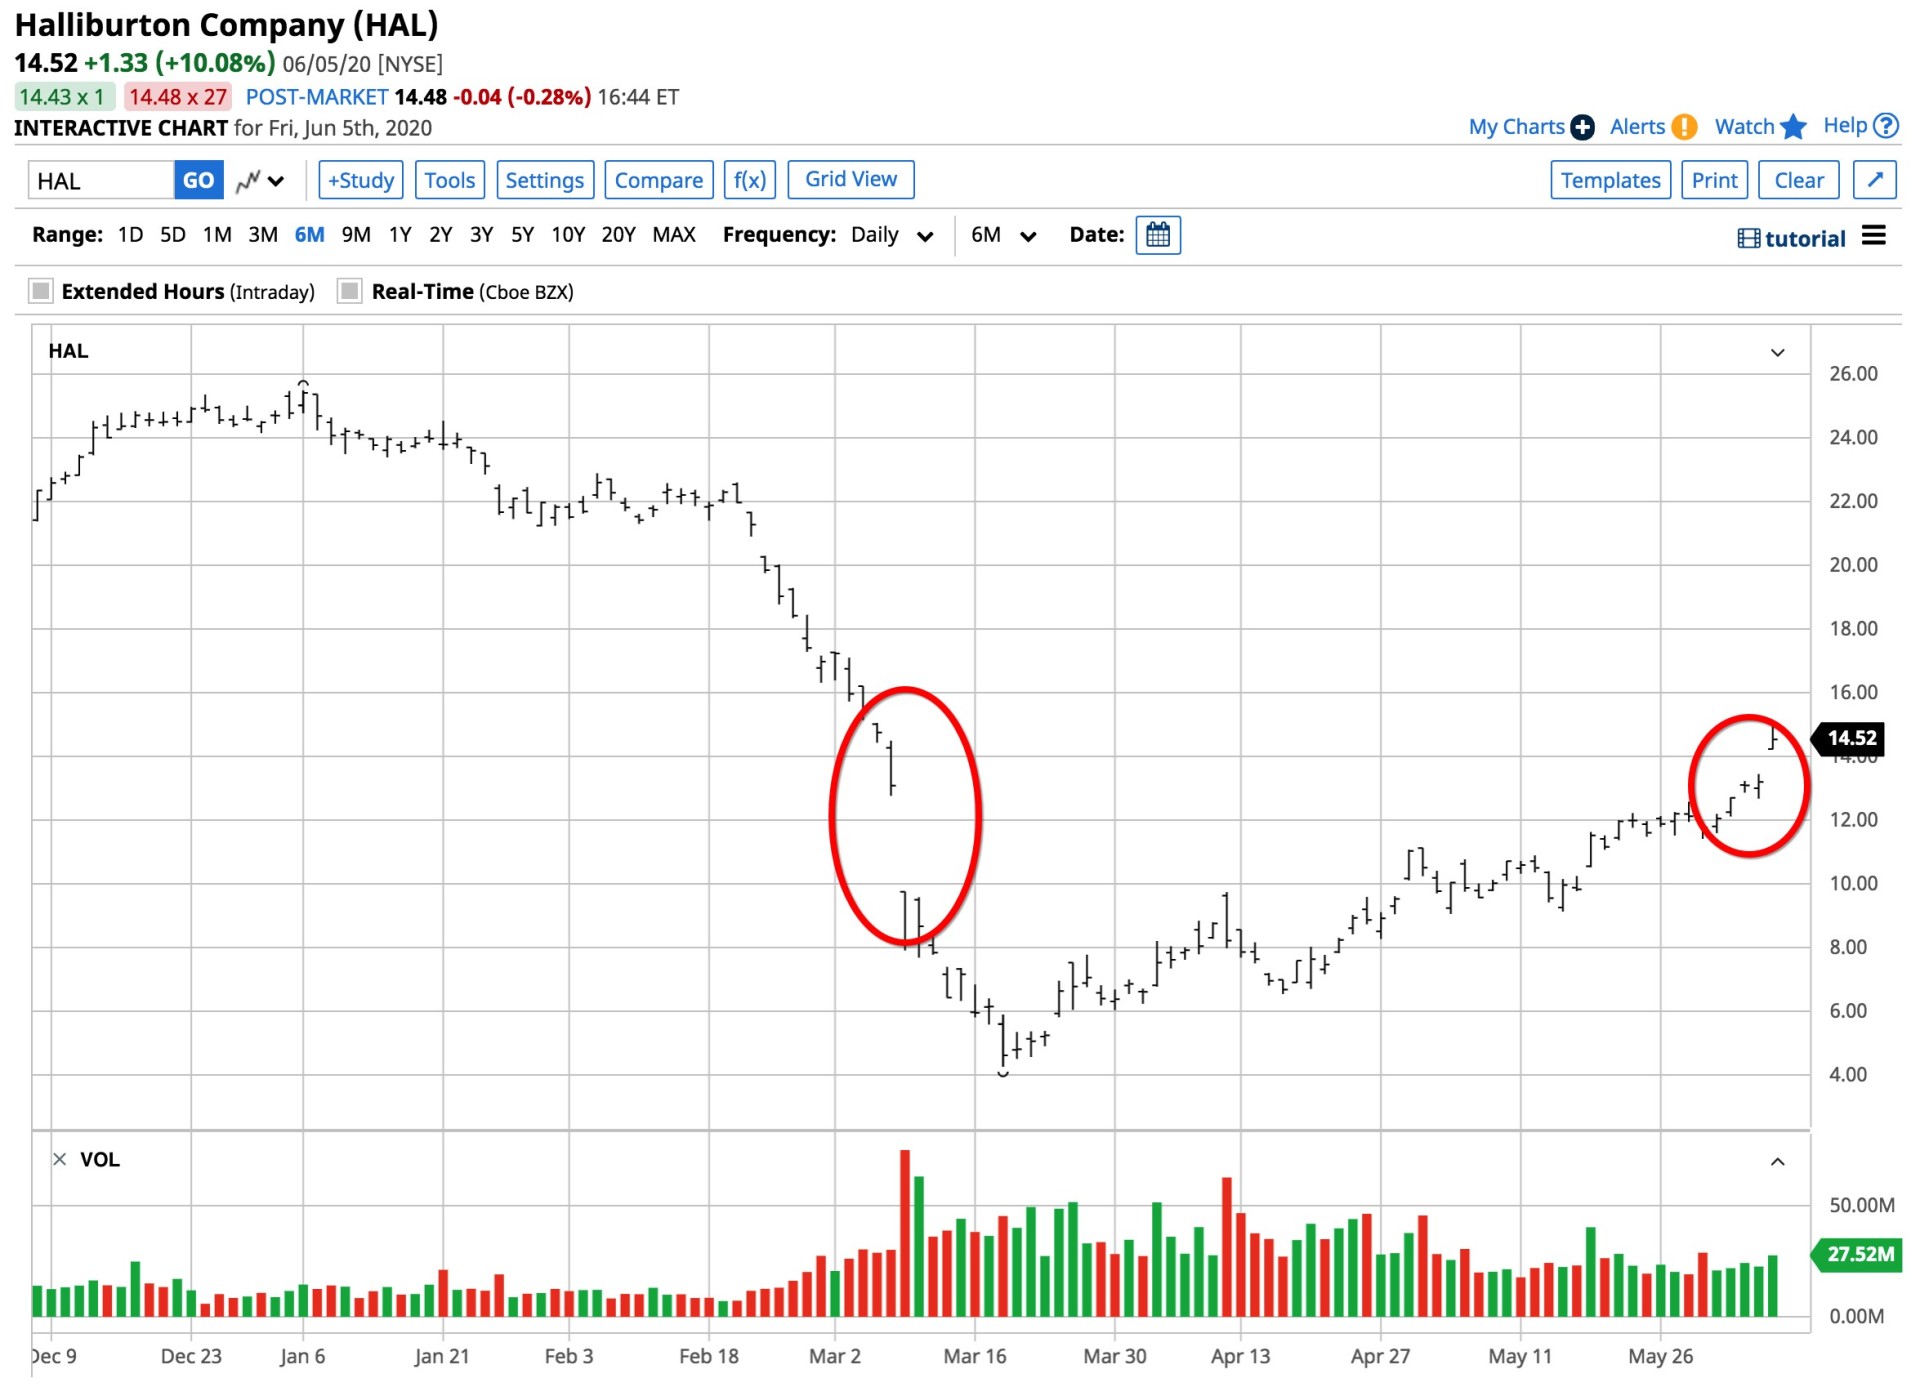
Halliburton (HAL) does even better as it works to fill its gap
During March, HAL shares dropped to a level not seen in decades when it traded to a low of $4.25 per share.
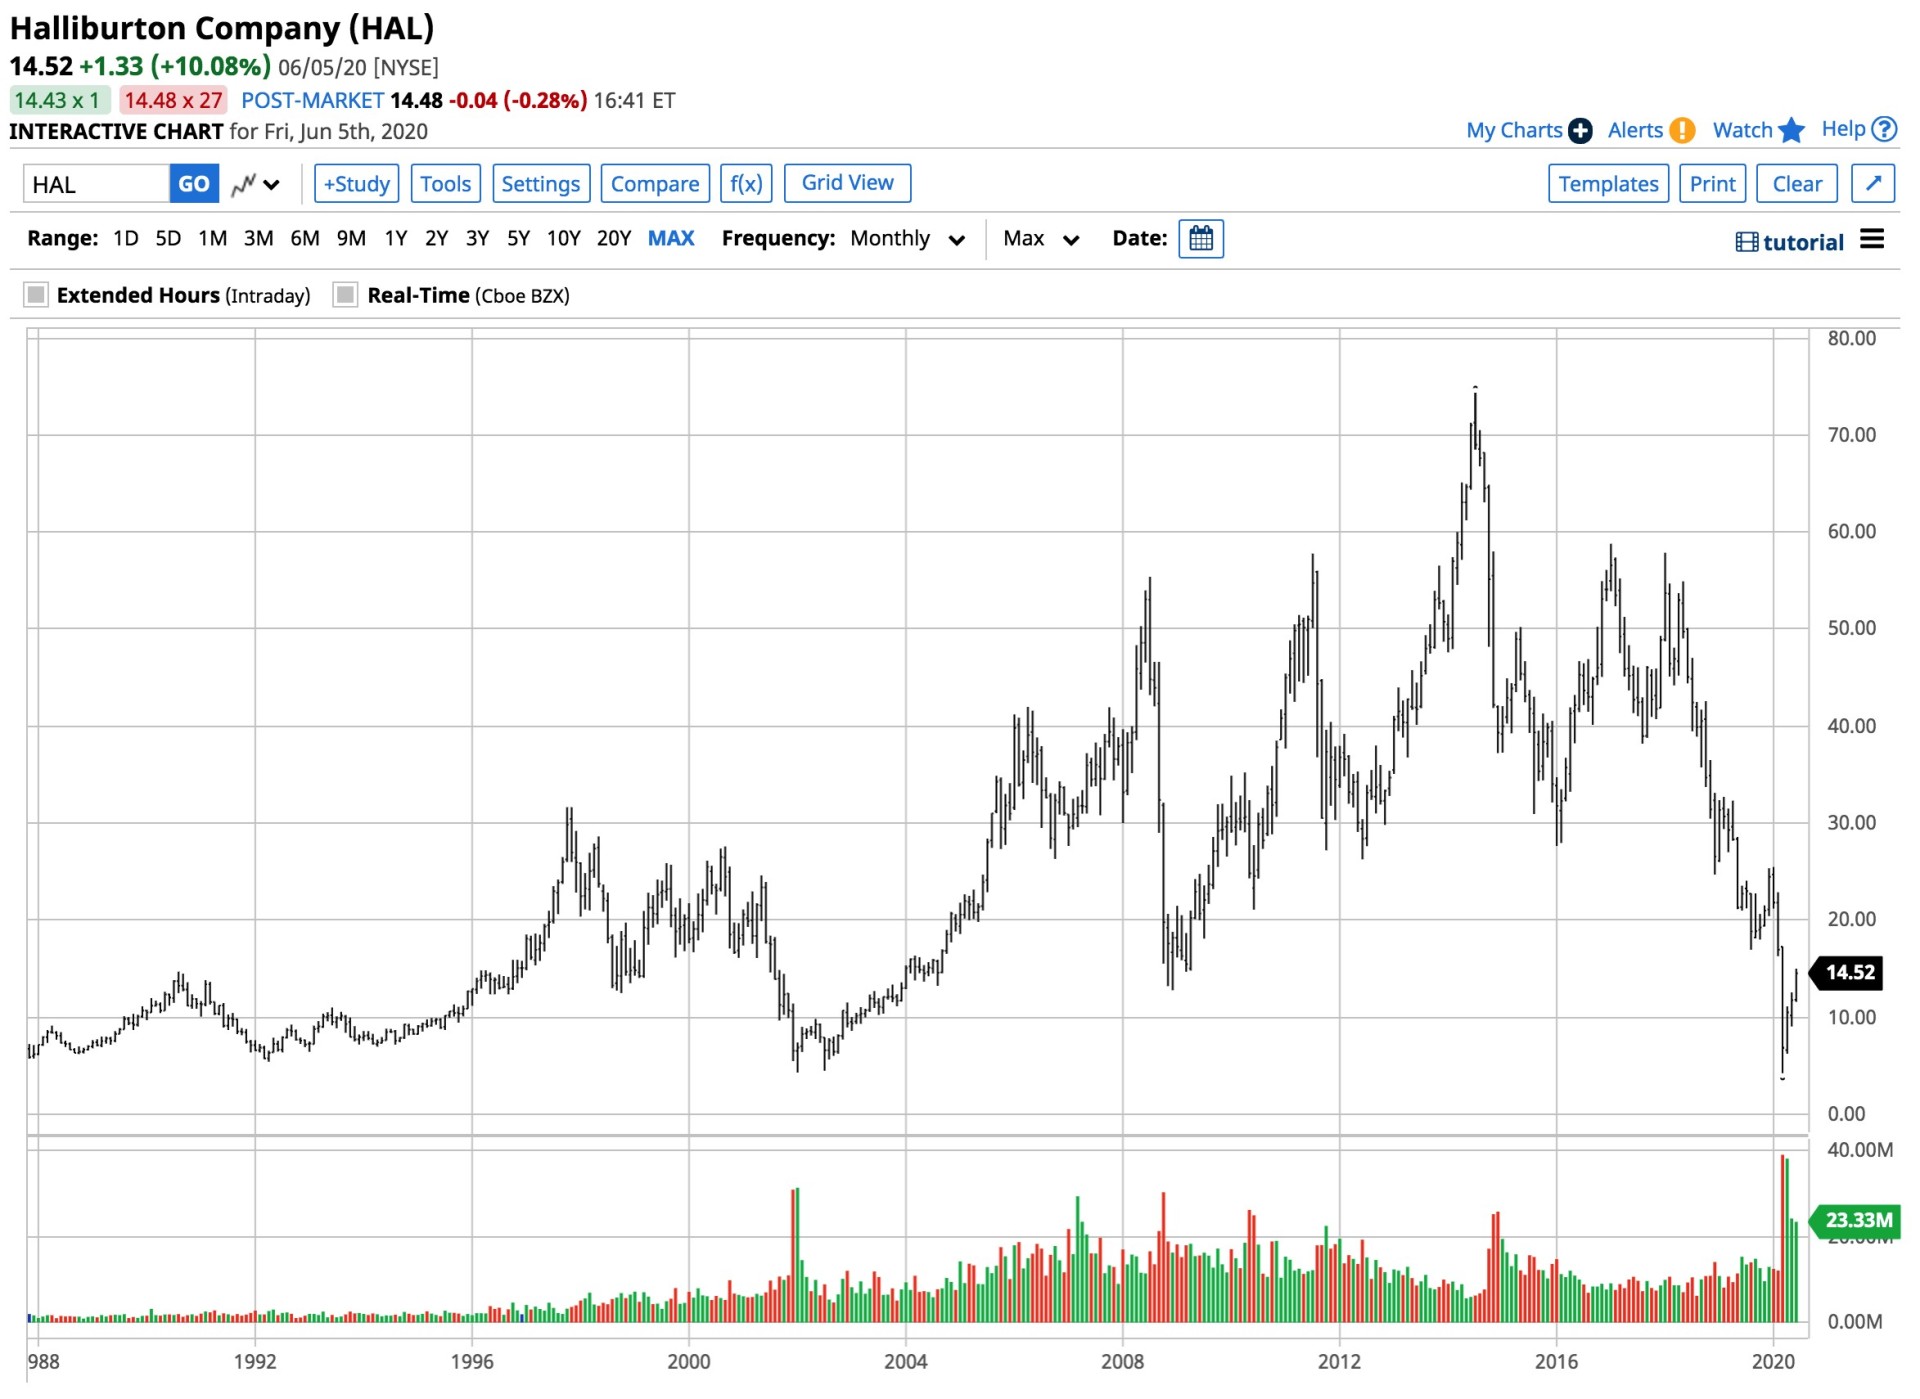
Source: Barchart
At $14.52 at the end of last week, the stock was over 3.4 times the price at the lows. HAL has a market cap of $12.738 billion and trades an average of over 33.5 million shares each day. The company pays a 1.2% dividend, which could disappear after the recent events in markets. On a percentage basis, HAL outperformed SLB since the March bottom in both stocks.
Source: Yahoo Finance
HAL has also been consistently profitable. However, analysts expect the company to post a loss in Q2 2020. Most companies will get a pass from the market as LPS or loss per share will be more common than EPS, particularly in the energy sector.
Source: Barchart
Meanwhile, the gap on the chart in HAL is from $9.74 to $14.48 per share. The price action last week filled the void as the shares traded to a high of $15.01. From June 4-5 HAL creates another gap from $13.43 to $14.21 per share.
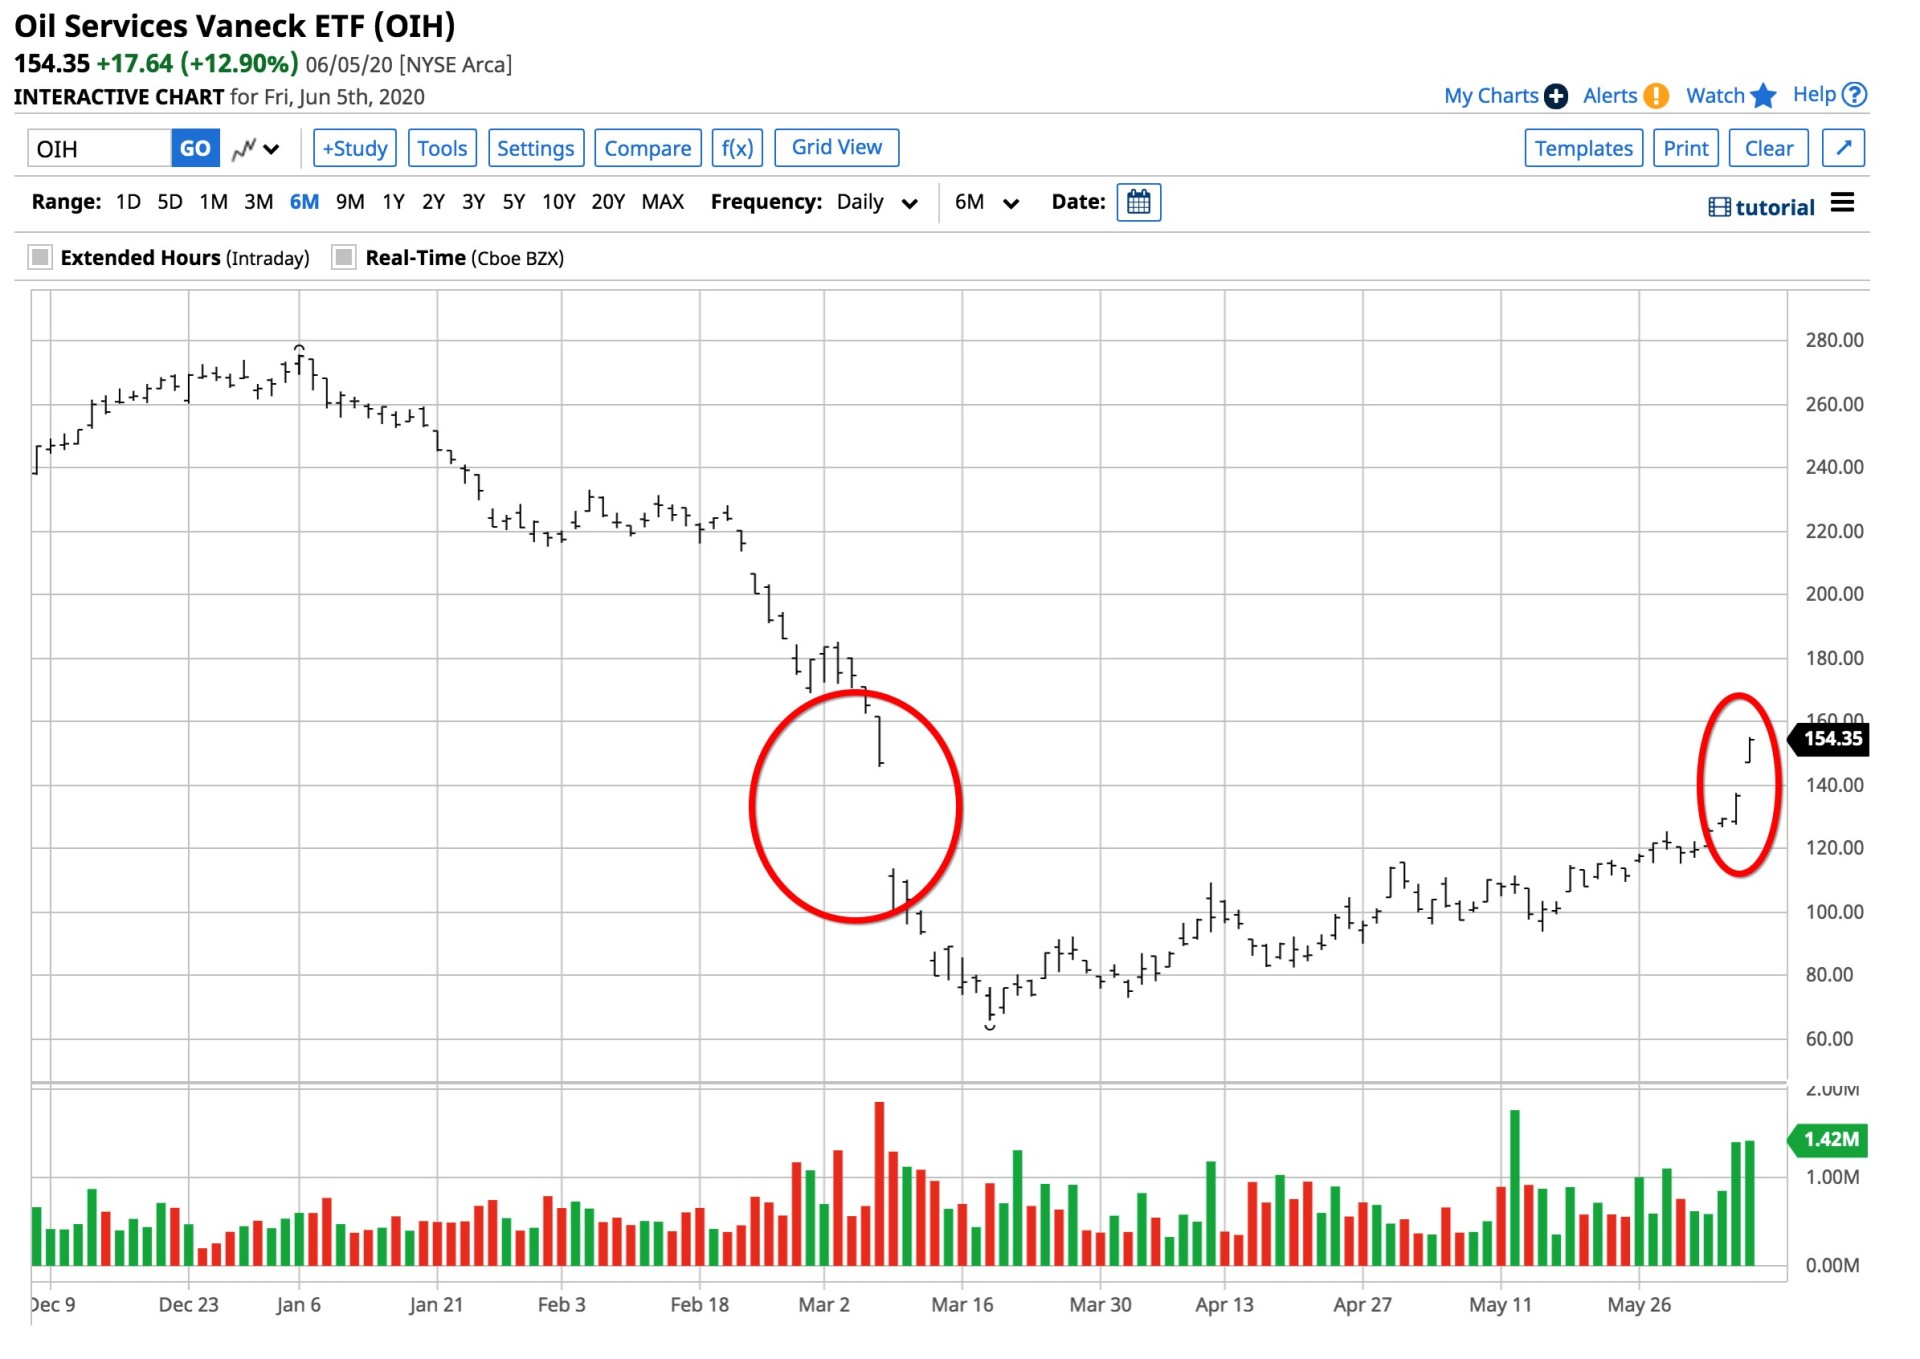
OIH diversifies risk in the oil services sector
The top holdings of the VanEck Vectors Oil Services ETF include:
Source: Yahoo Finance
SLB and HAL account for more than 27% of the ETF product. OIH has net assets of $480.61 million, trades an average of over 854,000 shares each day, and charges a 0.35% expense ratio. If the blended dividends of the holdings remain constant, which is a leap of faith, OIH yields 4.90% at $154.35 per share at the end of last week.
Source: Barchart
OIH recovered from a low of $66 in March to around the $130 per share level at the end of last week. The gap in OIH was between $113.80 and $145.80 per share. OIH filled the void last week, and like SLB and HAL, the ETF created another gap from $137.61 to $147.19 from June 4-5. The gap filled the void but created the potential for an island reversal on the ETF’s chart.
Gaps can act as magnets for price action over time. Oil services stocks have been the worst performers, so they could have more room for recovery given the move in crude oil. The moves last week were explosive.
Want More Great Investing Ideas?
9 “BUY THE DIP” Growth Stocks for 2020
Bull Market or Bull S#*t? How to trade today’s stock bubble and prepare for the return of the bear market.
7 “Safe-Haven” Dividend Stocks for Turbulent Times
SLB shares were trading at $22.51 per share on Tuesday afternoon, down $1.14 (-4.82%). Year-to-date, SLB has declined -42.79%, versus a 0.21% rise in the benchmark S&P 500 index during the same period.
About the Author: Andrew Hecht

Andy spent nearly 35 years on Wall Street and is a sought-after commodity and futures trader, an options expert and analyst. In addition to working with StockNews, he is a top ranked author on Seeking Alpha. Learn more about Andy’s background, along with links to his most recent articles. More...
More Resources for the Stocks in this Article
| Ticker | POWR Rating | Industry Rank | Rank in Industry |
| SLB | Get Rating | Get Rating | Get Rating |
| HAL | Get Rating | Get Rating | Get Rating |
| OIH | Get Rating | Get Rating | Get Rating |


