

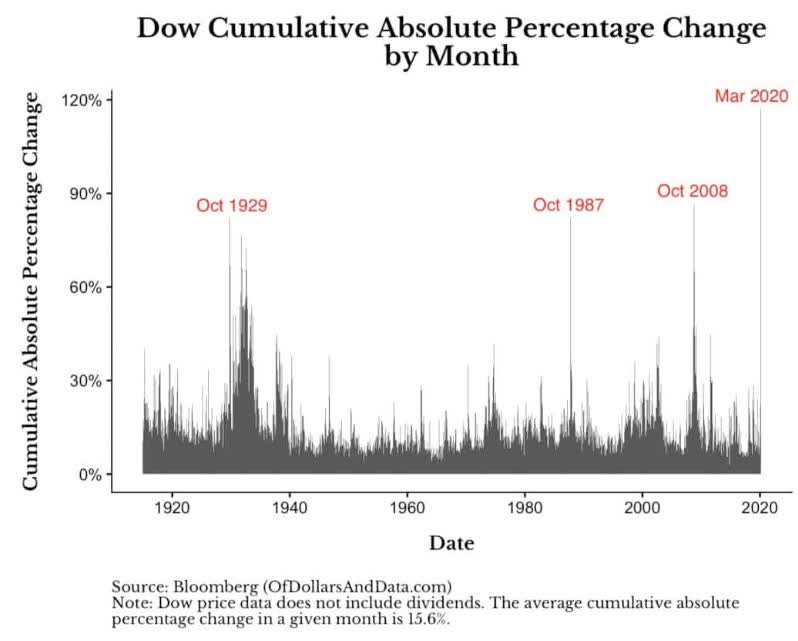
What a year it’s been for stocks! In March the market saw the highest volatility in history, which culminated with the S&P 500 falling 34% in just four weeks.
Then just as suddenly the market took off like a rocket, soaring 31% off its March 23rd lows and coming within 13% of its February 19th all-time high.
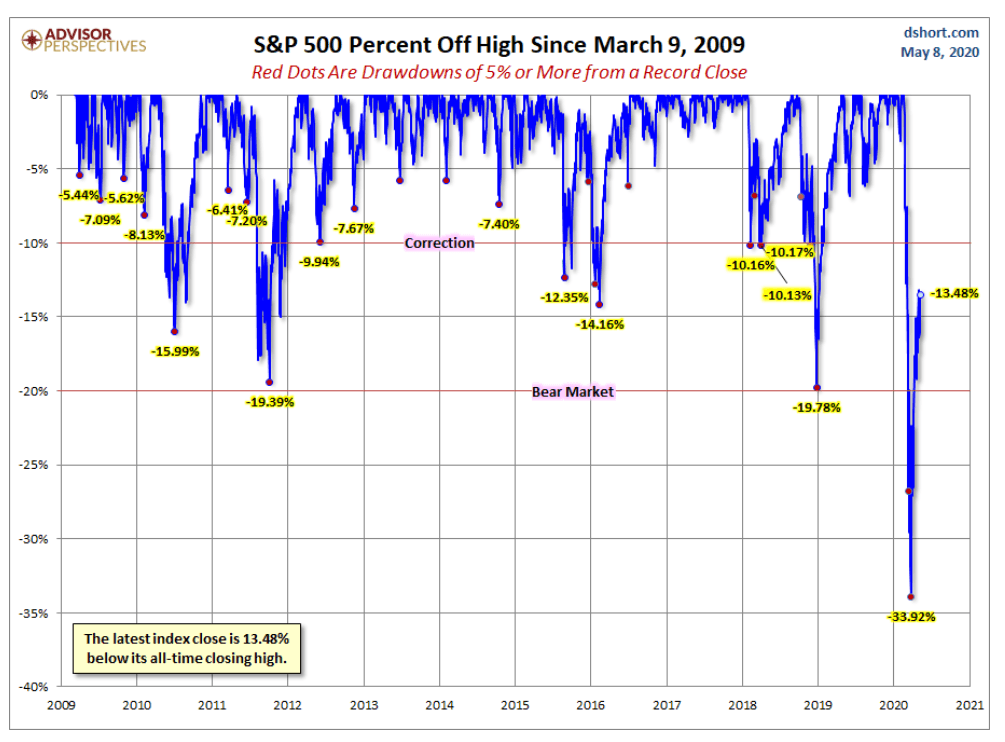
(Source: Advisor Perspectives)
To many, this might seem insane, given that we’re likely facing the worst quarter of economic growth in US history.
What’s more, we face numerous fundamental risks in what’s likely to be a 24 to a 30-month pandemic, that many fear could become the first depression in over 80 years.
Actually, fears of a depression are not without merit. There are actually two plausible ways this recession might become a depression and we’re at high risk of one of those catalysts happening this year.
What Is A Depression?
First, we need to define what we mean by “depression”.
The National Bureau of Economic Research defines a recession as, “a significant decline in economic activity spread across the economy, lasting more than a few months, normally visible in real GDP, real income, employment, industrial production, and wholesale-retail sales.”
While most people think of a recession as two consecutive quarters of negative GDP growth, that’s merely the rule of thumb we all use. The government agency in charge of dating recessions has a more opaque “I’ll know it when I see it” approach.
What does the NBER say about depressions?
They don’t have one, because the Great Depression, per the NBER, was actually two separate recessions.
Using the NBER business cycle dates, the first downturn of the Great Depression started in August 1929 and lasted 43 months, until March 1933, far longer than any other twentieth-century contraction. The economy then expanded for 21 months, from March 1933 until May 1937, before suffering another downturn: from May 1937 until June 1938, a period of 13 months, the economy again contracted.” – Federal Reserve Bank of San Francisco
Since the NBER was founded in 1920, by its rationale it’s never had to define such a thing.
Most economists consider a depression to be an especially bad recession.
But where does one draw the line? Here’s Ben Bernanke whose Ph.D. thesis was on the causes of the Great Depression providing an example.
During the major contraction phase of the Depression, between 1929 and 1933, real output in the United States fell nearly 30 percent. During the same period, according to retrospective studies, the unemployment rate rose from about 3 percent to nearly 25 percent, and many of those lucky enough to have a job were able to work only part-time. For comparison, between 1973 and 1975, in what was perhaps the most severe U.S. recession of the World War II era, real output fell 3.4 percent and the unemployment rate rose from about 4 percent to about 9 percent.
Other features of the 1929-33 decline included a sharp deflation—prices fell at a rate of nearly 10 percent per year during the early 1930s—as well as a plummeting stock market, widespread bank failures, and a rash of defaults and bankruptcies by businesses and households.
The economy improved after Franklin D. Roosevelt’s inauguration in March 1933, but unemployment remained in the double digits for the rest of the decade, full recovery arriving only with the advent of World War II. Moreover, as I will discuss later, the Depression was international in scope, affecting most countries around the world not only the United States.”
Most economists (at least those polled by NPR) concur that a depression would be different from a recession in that:
- Unemployment rises much higher
- The downturn lasts at least a few years
- Deflation in most goods (falling prices)
- Widespread or even global in nature
- A sharp rise in bankruptcies
Or you can just use a simpler definition which is what Moody’s does. According to Mark Zandi, chief economist of Moody’s, his firm defines a depression as “12 consecutive months of double-digit unemployment.”
We’re now at 14.7% unemployment officially (though other measures are as high as 22.8%) and so per Moody’s definition we might be in a depression should unemployment fail to hit single digits by March 2021.
For the purposes of this article, let’s use Moody’s definition since at least it’s easy to quantify and confirm with government data.
Catalyst 1: Another Financial Crisis
St. Louis Fed President James Bullard: “When you’re in a crisis like this you’re always waiting for other shoes to drop…
I don’t want to be in this situation too long. You are taking the risk of a prolonged downturn, even a depression, and you are taking the risk of a financial crisis.”
Last week we heard from six Fed Presidents and none of them said they expect a depression. In fact, MN Fed President Neel Kashkari specifically said that he doesn’t expect one.
But St. Louis Fed President James Bullard, who warned about a 50% GDP contraction in Q2 and peak unemployment of 32% to 40% weeks ago, pointed out that a depression is possible if another financial crisis were to occur, and policymakers made several critical mistakes.
What is the risk of this severe recession becoming a financial crisis, and then triggering a full-blown (if short by most definitions) depression?
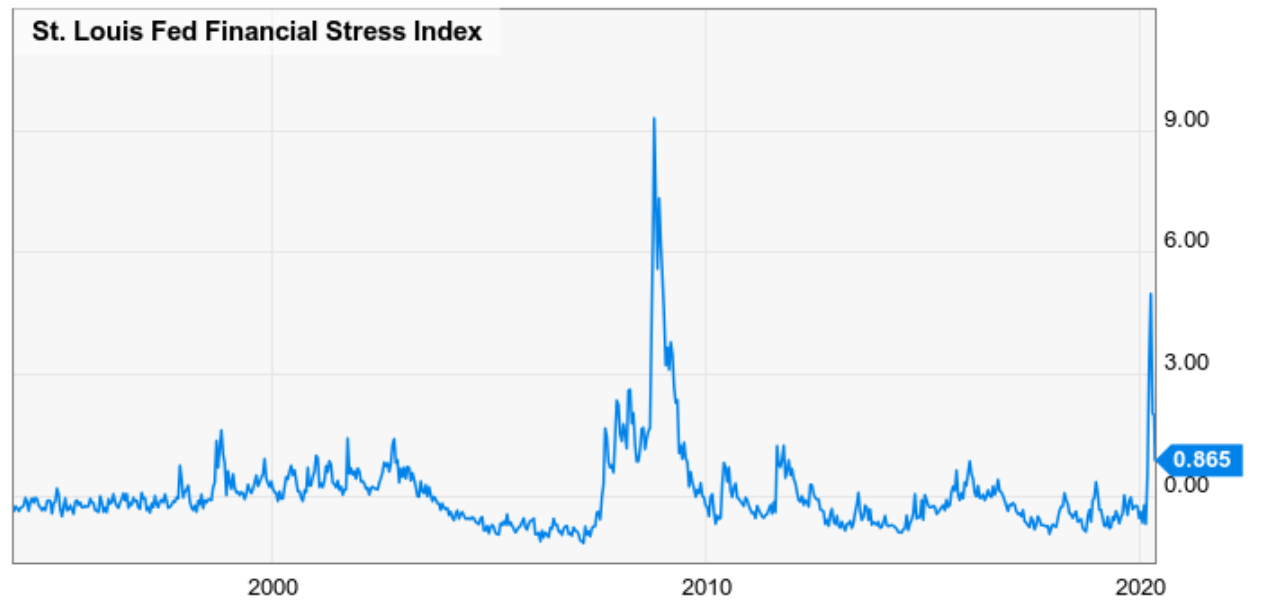
(Source: Ycharts)
The St. Louis Financial Stress Index uses 18 weekly financial reports to estimate total US financial stress compared to the average since 1993.
- 0 = average since 1993
- +1 = average during the 2000 recession and the Asian Financial Crisis/Russian default crisis
- 9.3 Financial Crisis peak
- 5.7 peak during this recession
- 0.87 today = normal recessionary conditions
While financial stress did rise at its fastest pace in recorded history in March, due to a global liquidity crunch (which sent virtually all asset prices crashing simultaneously) the Fed’s nine emergency programs managed to flood the credit markets with so much liquidity that financial stress has lessened considerably.
In fact, we’re now at financial stress levels seen in normal recessions.
What about the corporate bond market? With companies taking on record amounts of debt over the past decade, due to record low-interest rates, perhaps a wave of corporate defaults could trigger a financial crisis and a depression courtesy of bankruptcies and mass layoffs?
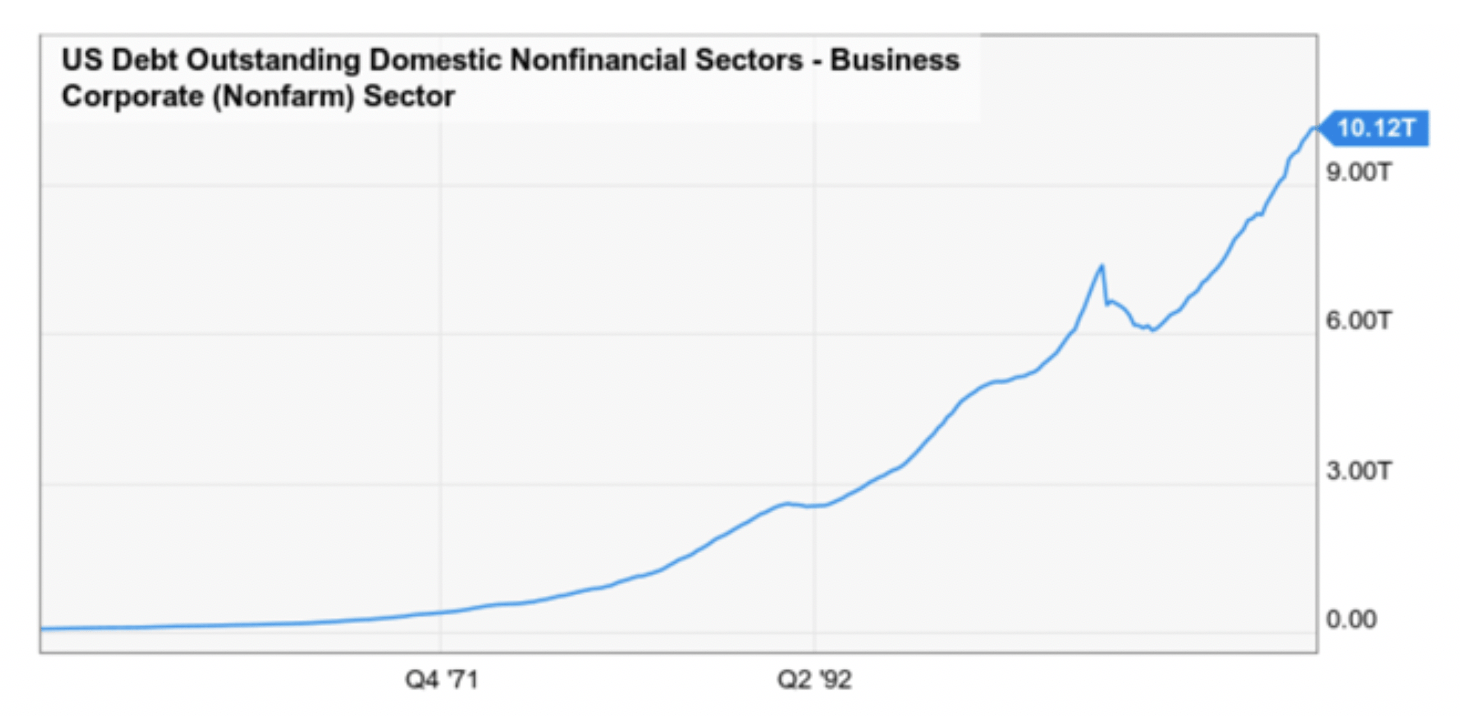
(Source: Ycharts)
While corporate debt is at all-time highs, as a percentage of market cap corporate debt isn’t historically high at all.
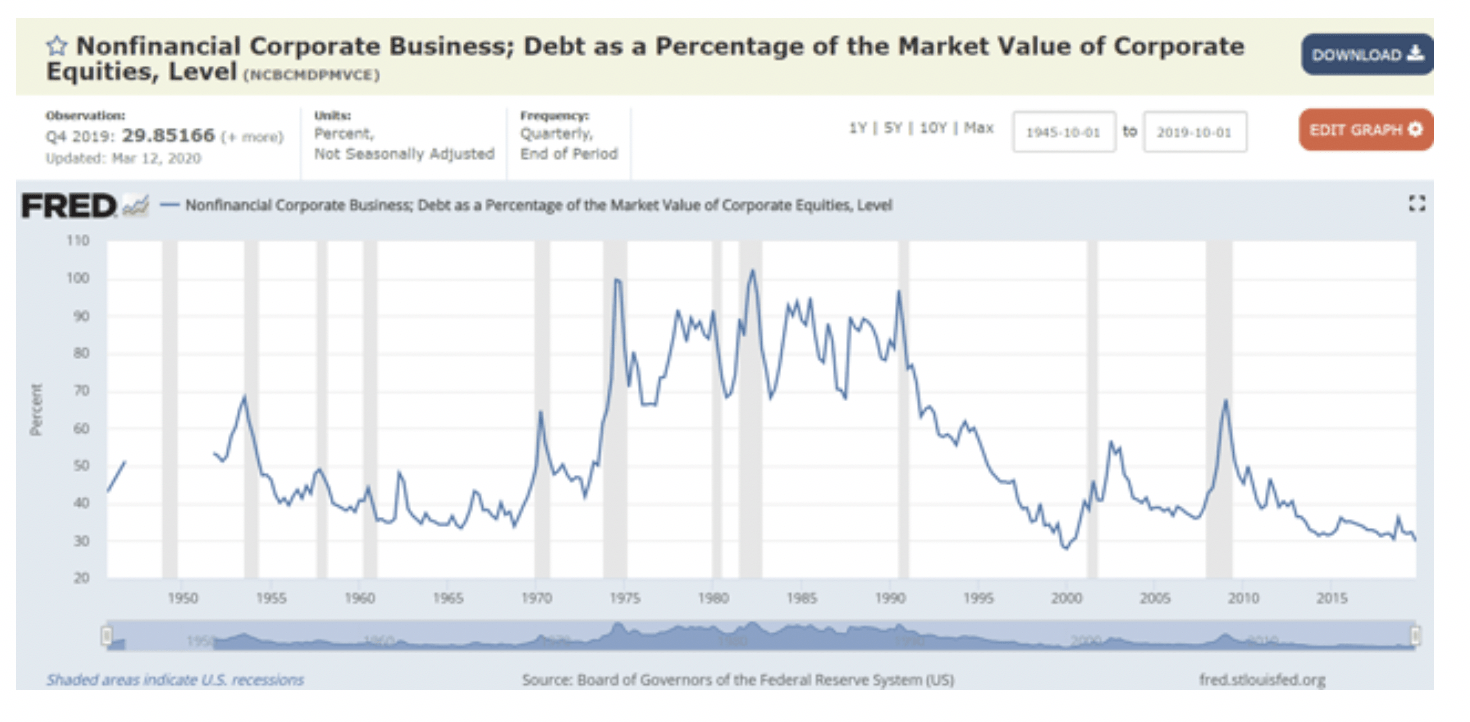
In fact, it’s at a 20-year low.
What about maturing debt though? Surely if companies can’t refinance a lot of debt maturing this year or in 2021 that could trigger a lot of bankruptcies, right?
Indeed, it could, but here too we see little reason for concern in the actual data.
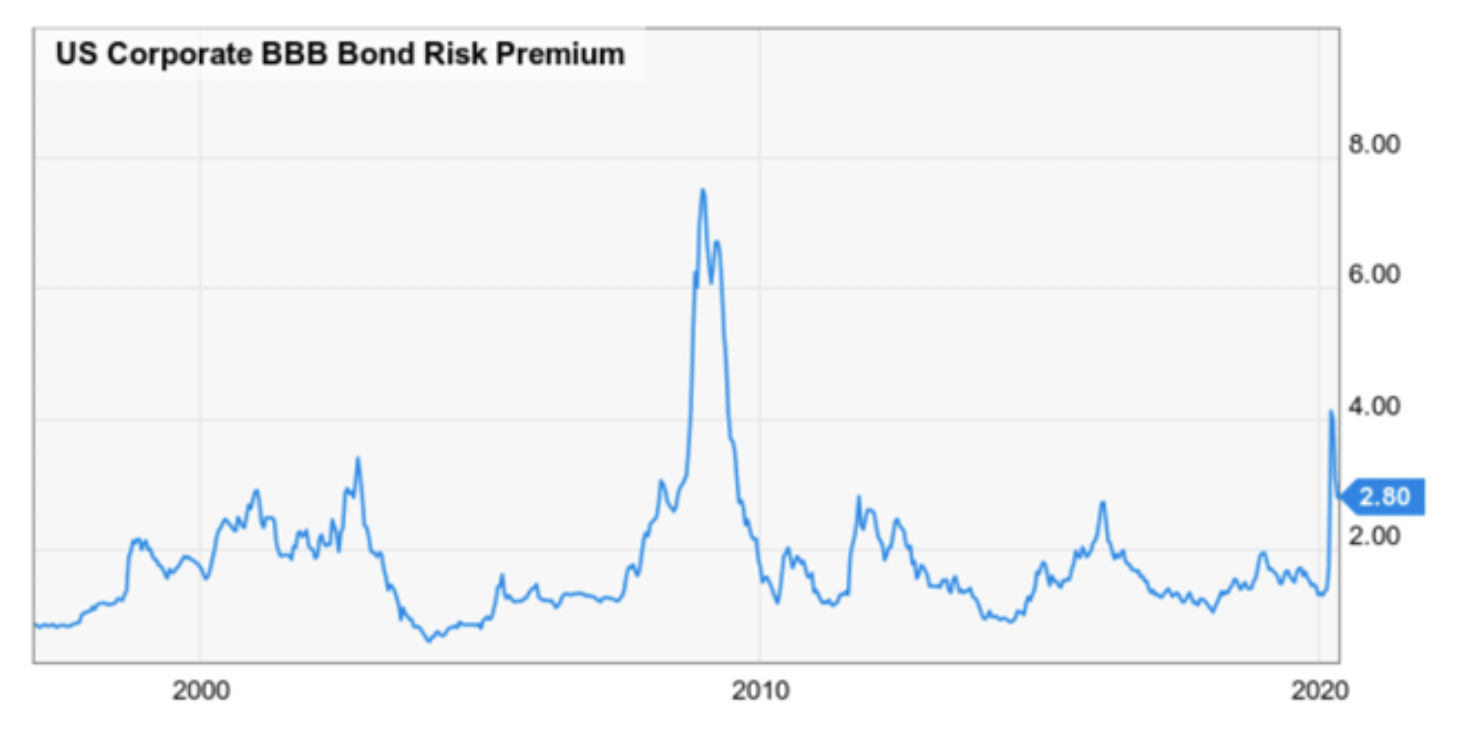
(Source: Ycharts)
50% of US corporate debt is BBB rated according to S&P and Moody’s. The difference between BBB bond yields and 10-year US Treasury yields is called the risk spread and serves as a good proxy for corporate credit brightness.
The BBB risk spread did hit almost 4% in March but has seen fallen to 2.8%.
What about junk bonds? Surely a wave of junk bond bankruptcies could still trigger a potential financial crisis, right?
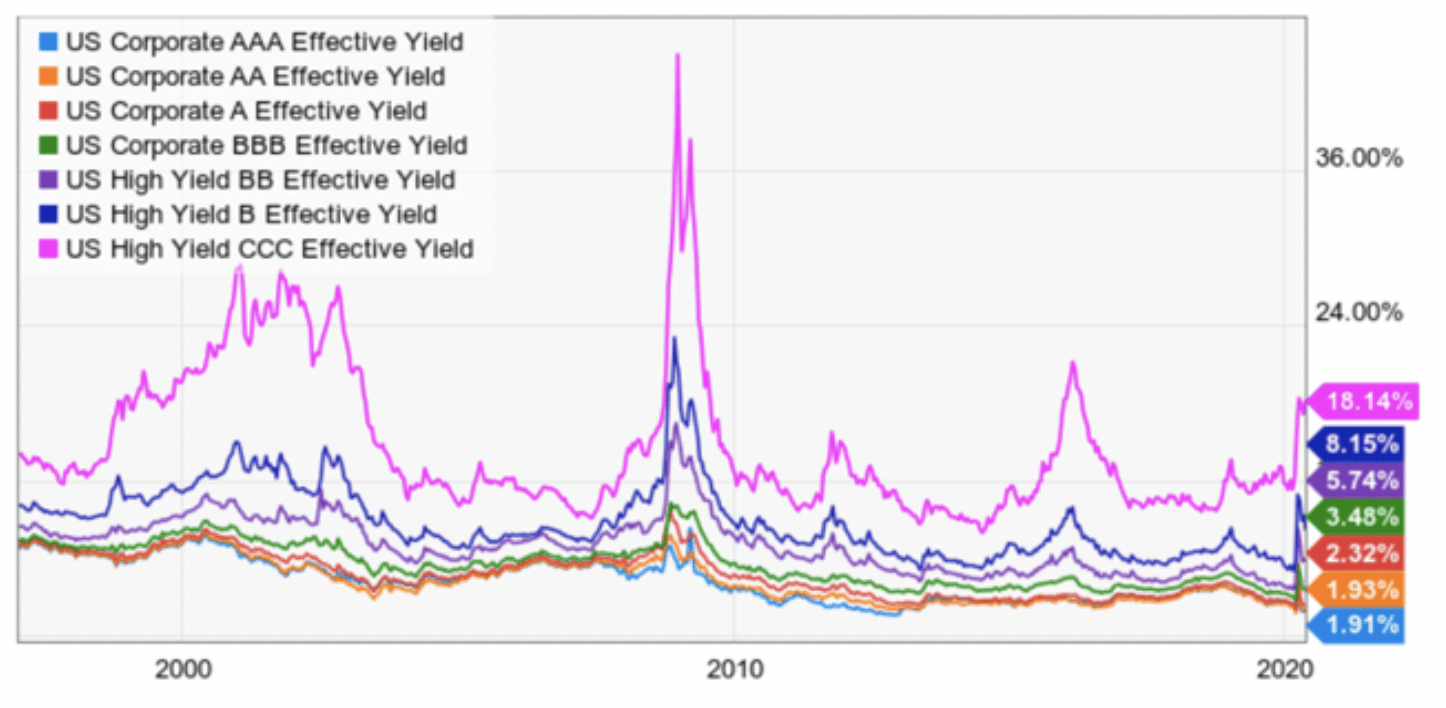
(Source: Ycharts)
CCC rated debt, literally one level above default has seen its effective yields soar recently. Many such companies are oil companies suffering from the worst oil crash in history.
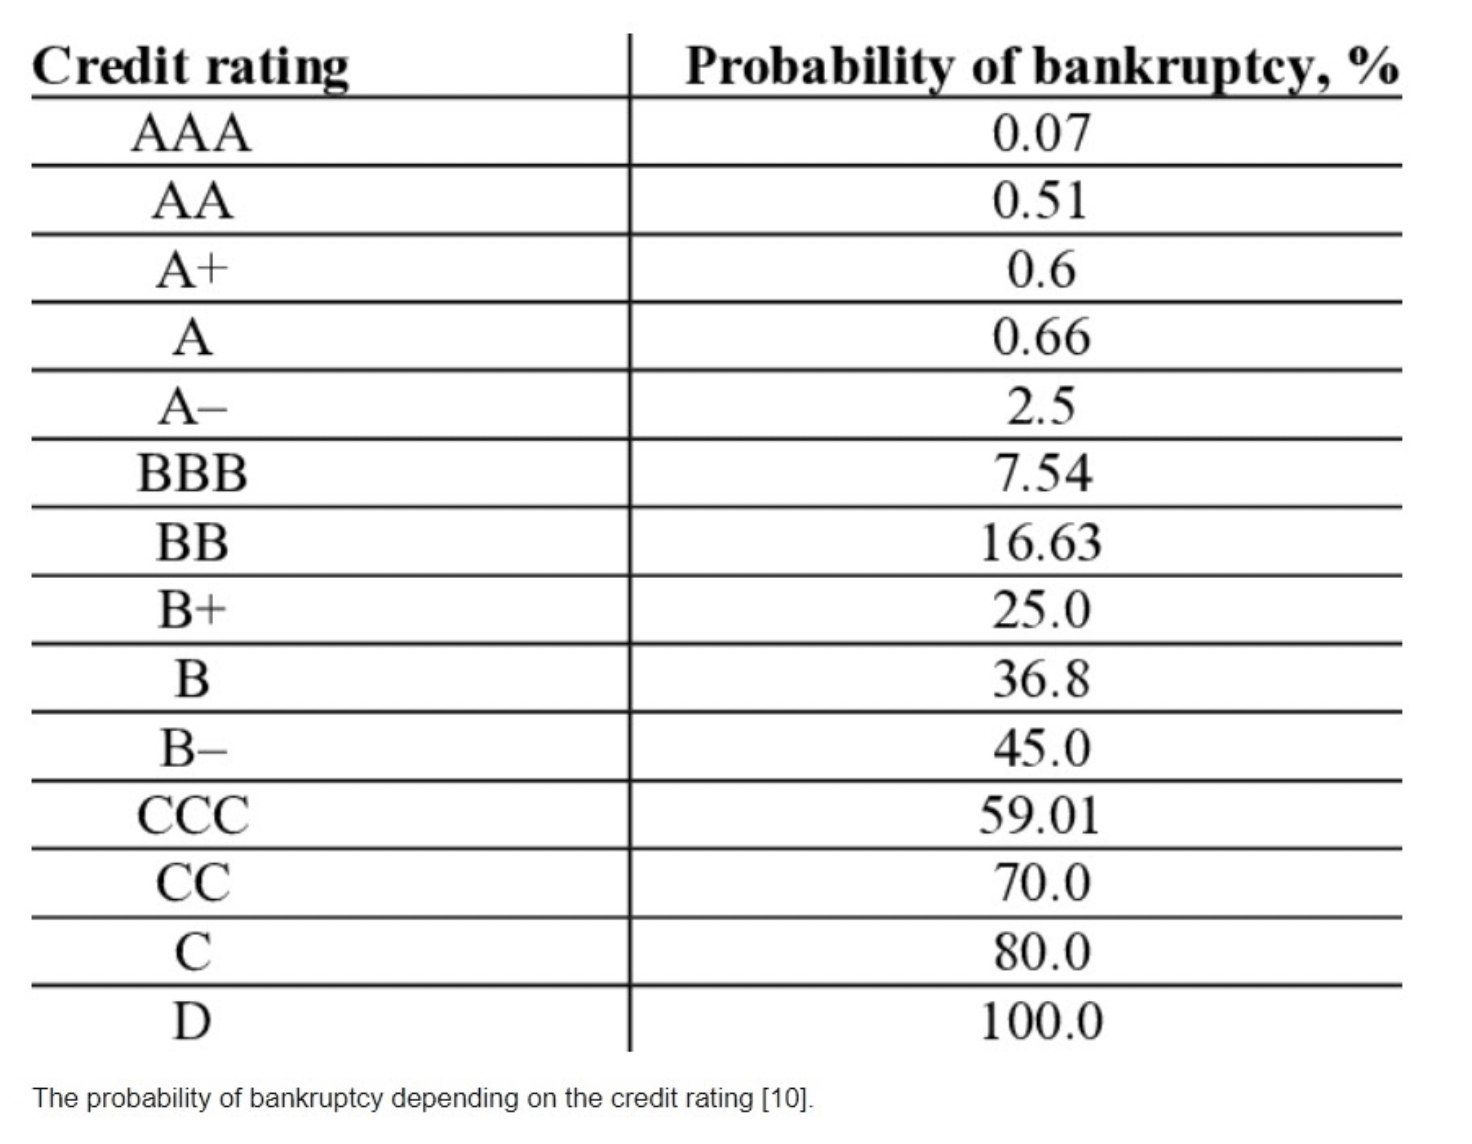
(Source: the University of St. Petersburg)
But CCC rated companies have a 59% long-term (30-year) bankruptcy risk, which is surprisingly low.
BBB rated companies have just 7.5% bankruptcy risk and even junk bond rated companies, BB or better rated, have seen their borrowing costs stabilize at about 8%.
That’s roughly half the level seen in the Great Recession when some junk bonds yielded over 40%.
What about state and local governments? The Fed has pledged to buy $500 billion in muni bonds, and can effectively buy as many as it takes to prevent a wave of state bankruptcies.
Basically, the Fed, via literally pledging infinite liquidity (and Treasury signing off on it) has made another financial crisis a lot less likely.
In fact, that’s the exact point MN Fed President Neel Kashkari made last week after the worst jobs report in history which he himself described as “devastating” and said actual unemployment was likely 23% to 24%.
I don’t think we’re actually headed for another Great Depression…Part of the reason the Great Depression was as bad as it was was that policymakers in the 1930s did the wrong thing. I think we’ve learned from that.” – Neel Kashakari
During the Great Depression, policymakers made three critical mistakes
- the Smoot Hawley tariffs triggered a global trade war that slashed demand for US exports
- Congress cut spending by 25% to balance the budget and “instill confidence in the dollar”.
- The Fed tightened the money supply to “instill confidence in the dollar”.
While President Trump has recently rattled his tariff saber once more, there is very little risk of a full-blown global trade war.
Congress has already approved $3 trillion in stimulus and Goldman Sachs estimates that “at least” $1 trillion more is coming.
And the Fed?
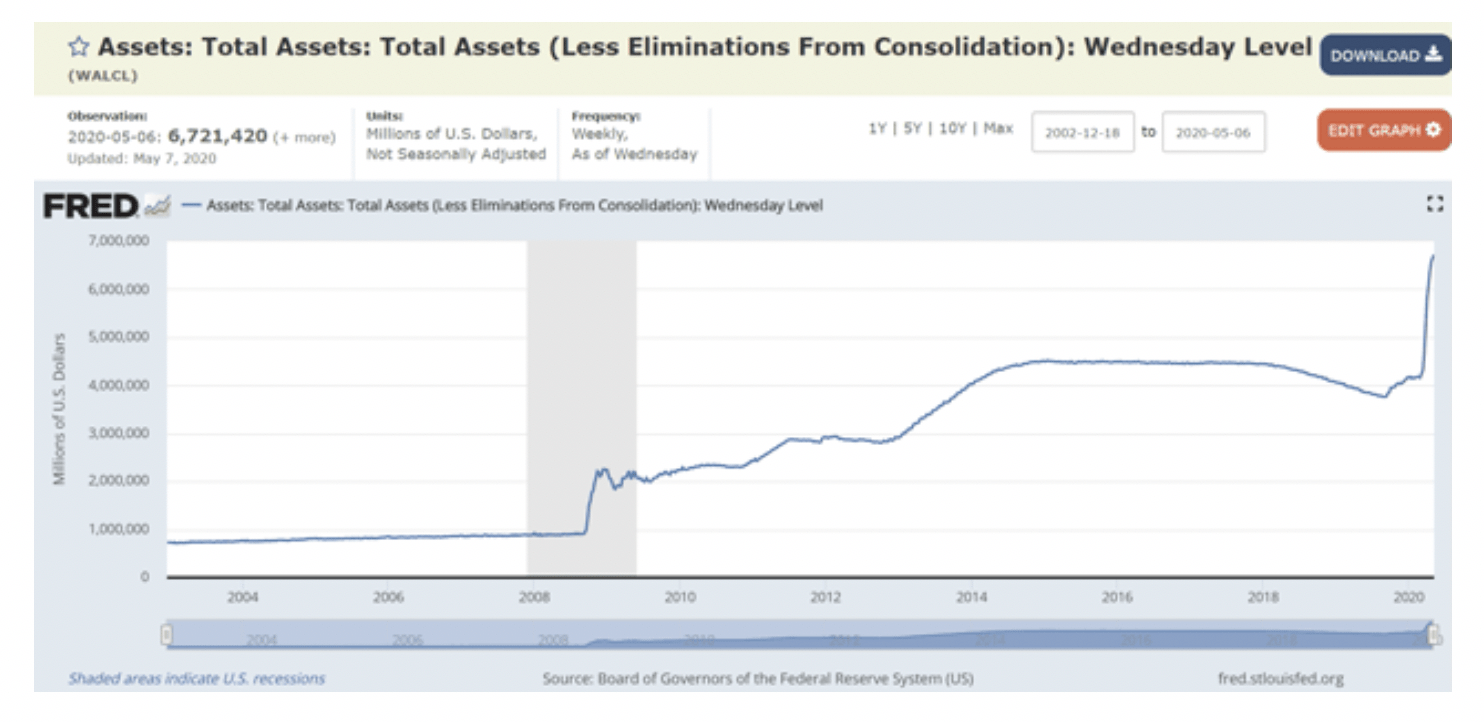
Its balance sheet is up $2.5 trillion since mid-February to $6.7 trillion. Most economists expect it to top out at about $10 trillion before its done with the mother of all QE operations.
What about the dollar weakening so much that a crashing dollar, due to too much Fed QE, might trigger a financial crisis and a depression?
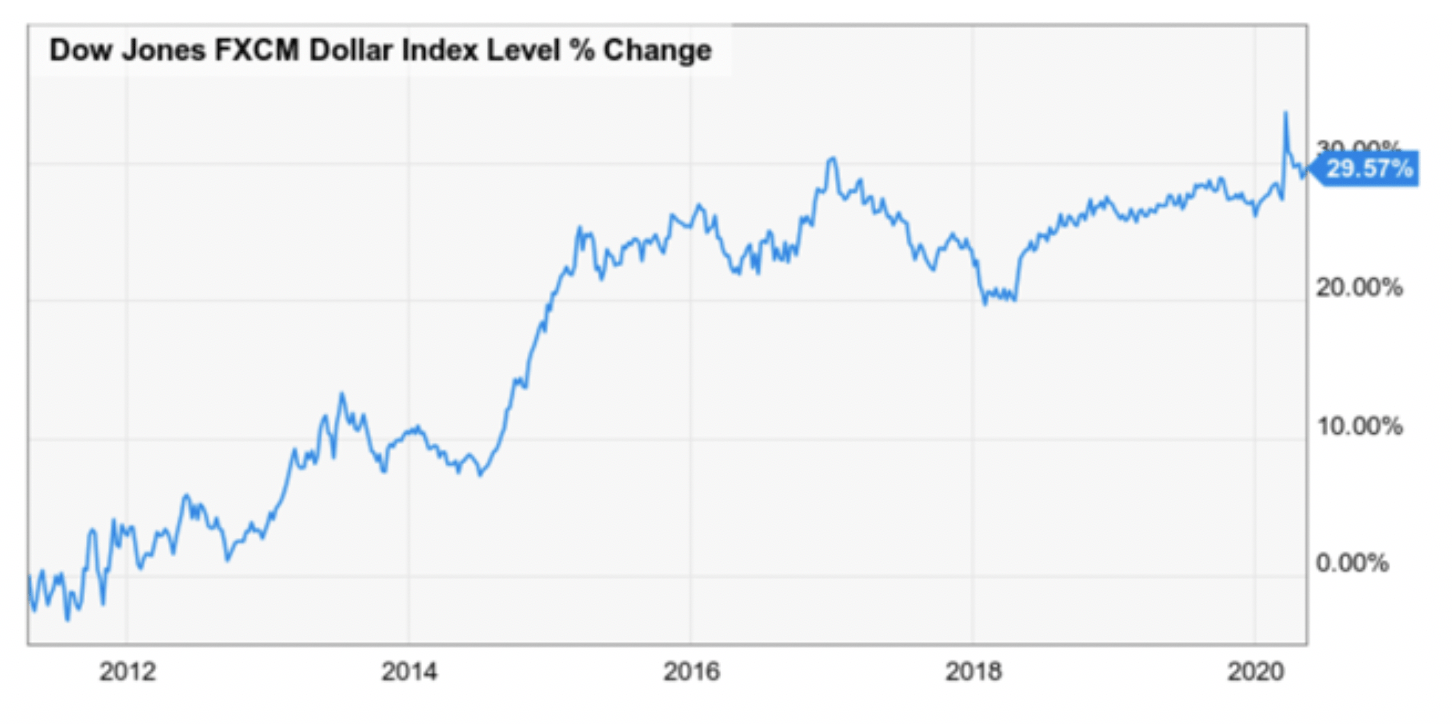
(Source: Ycharts)
Actually, because so many other central banks are printing money as fast or faster than the Fed, the US dollar is actually appreciating in value, as it has pretty steadily for a decade.
Basically, there is very little risk of a financial crisis triggering another depression.
So that’s the good news, that the main catalyst for another depression we’ve worried about for 12 years is likely to not occur this time around.
However, there is one catalyst for depression that is not just higher risk, but far more likely to happen.
In part two of this series, I’ll explain what that catalyst is and what we can do to hopefully avert the worst recession in 75 years turning into an outright, market smashing depression.
Want More Great Investing Ideas?
9 “BUY THE DIP” Growth Stocks for 2020
7 “Safe-Haven” Dividend Stocks for Turbulent Times
REVISED 2020 Stock Market Outlook– Discover why there is more downside ahead and the Top 10 picks for the bear market.
SPY shares were trading at $282.58 per share on Wednesday morning, down $4.09 (-1.43%). Year-to-date, SPY has declined -11.69%, versus a % rise in the benchmark S&P 500 index during the same period.
About the Author: Adam Galas

Adam has spent years as a writer for The Motley Fool, Simply Safe Dividends, Seeking Alpha, and Dividend Sensei. His goal is to help people learn how to harness the power of dividend growth investing. Learn more about Adam’s background, along with links to his most recent articles. More...
More Resources for the Stocks in this Article
| Ticker | POWR Rating | Industry Rank | Rank in Industry |
| SPY | Get Rating | Get Rating | Get Rating |


