

To say that we’re seeing an unprecedented recession right now would be an understatement.
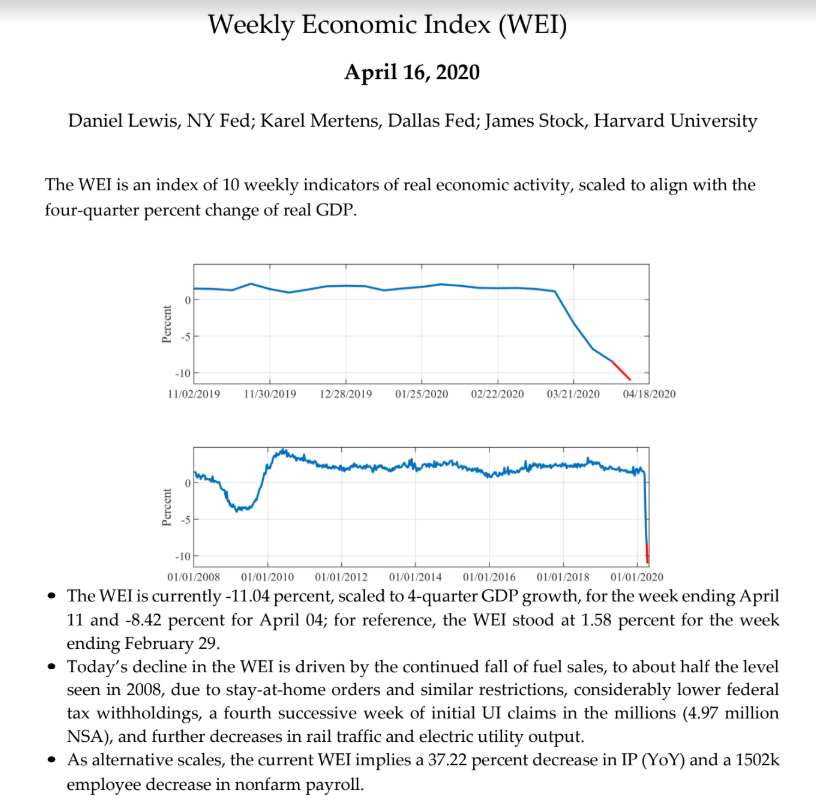
(Source: NY & Dallas Feds, Harvard)
According to the high-frequency economic model built by the New York Fed, Dallas Fed, and Harvard, we’re currently contracting at an annualized rate of -37%.
For context, the previous record for the worst quarter of US growth was -10% in 1958. And the rate of contraction is only getting worse (it was -30% two weeks ago).
Naturally, investors want to know when this economic cataclysm will bottom, which could confirm the S&P 500 bottomed on March 23rd, after declining a peak (so far) 32% from previous highs.
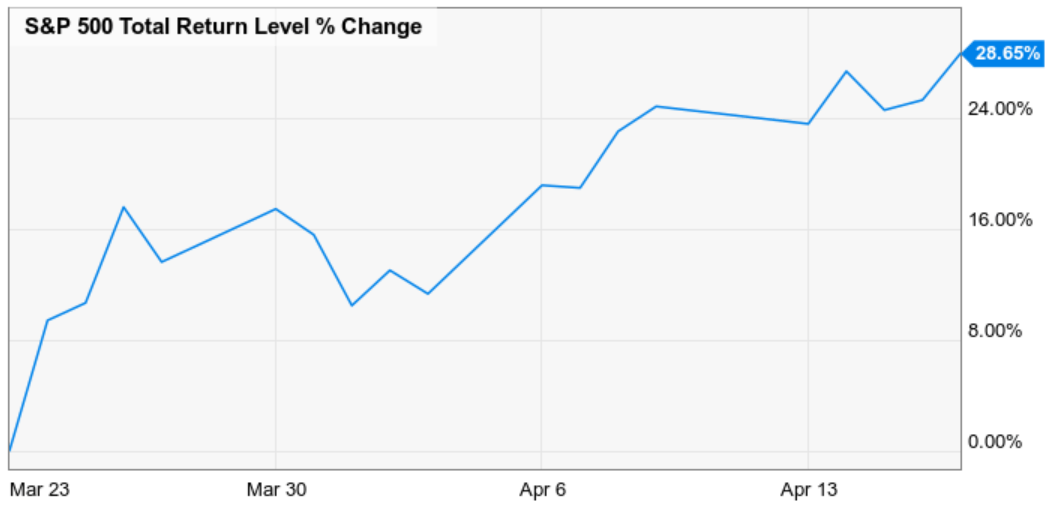
(Source: Ycharts)
That would also help a lot of people sleep better at night after watching stocks stage a massive 30% rally in just under a month.
So here are the two most important things investors have to know about when America can begin to restart its economy and hopefully begin our long road to recovery from what the IMF is now calling “the Great Lockdown”.
Restarting the Economy Isn’t Like Flipping a Switch
Until we have a vaccine approved, mass-produced and distributed to close to 8 billion people (or 80+% of us have gotten the virus and created herd immunity), life won’t be able to get back to normal.
Here is what restarting the economy looks like, based on the Federal Guidelines that were released on April 16th.
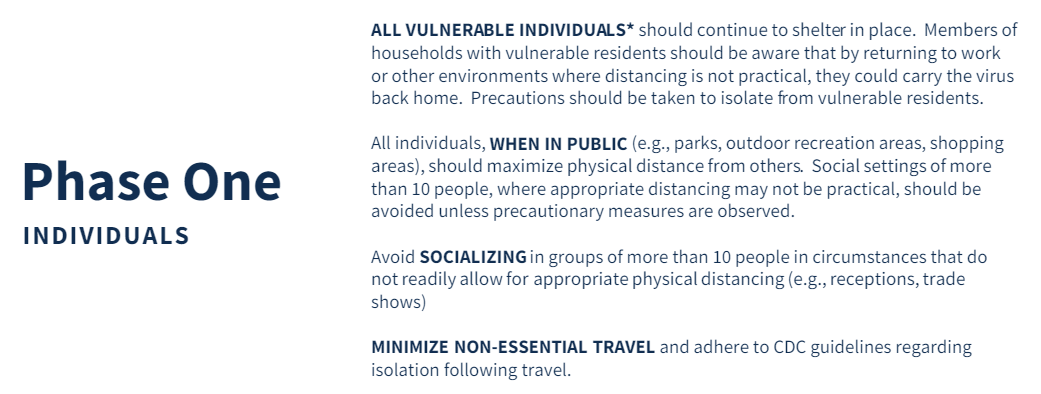
(Source: Federal restart guidelines)
These are basically the same phased restart guidelines that all countries are planning to follow and are based on the Fauci protocols which have three main tenants.
- 2 weeks of declining new daily cases
- medical system is able to withstand a potential spike in cases (second wave following phase 1 restart)
- adequate testing is available to trace contacts of anyone who tests positive for COVID-19
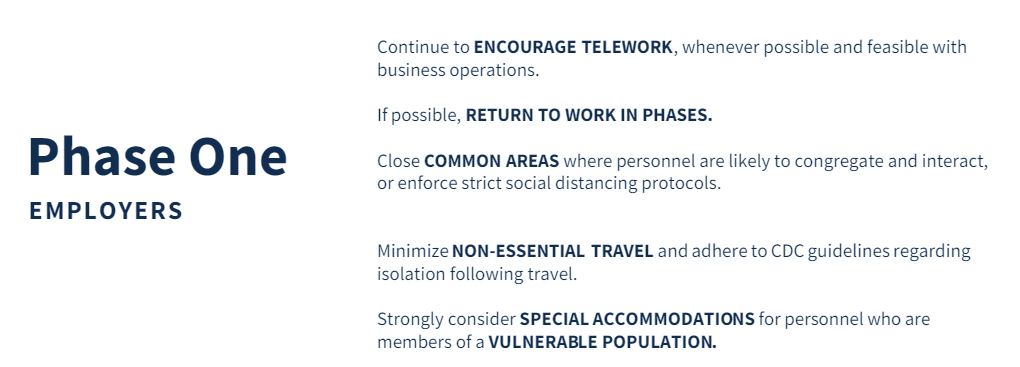
The good news is that things will likely soon get a bit better for the economy. The bad news is that even phase two and phase three aren’t anywhere close to “normal” as many people think of it.


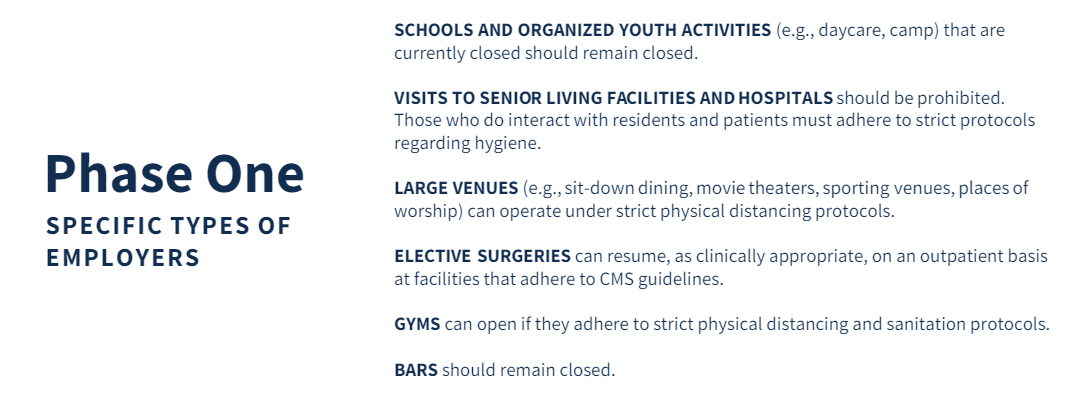
(Source: Federal restart guidelines)
Not until phase two can business travel commence, and schools reopen.
Bars will remain closed in phase one and visits to senior housing facilities will be restricted.


(Source: Federal restart guidelines)
Not until phase three do we being to approach the new normal that will be with us until we can vaccinate enough people to prevent the threat of another pandemic (potentially not until mid-2022 for widespread distribution of the vaccine).
That’s when most people currently telecommuting will be able to go back to work.
Still, with the economy now contracting at close to 40% on an annualized basis, anything is better than remaining locked down for a day longer than we have to.
So here’s when we might start to see states begin to reopen.
A Realistic Timeline for Beginning to Reopen the Economy
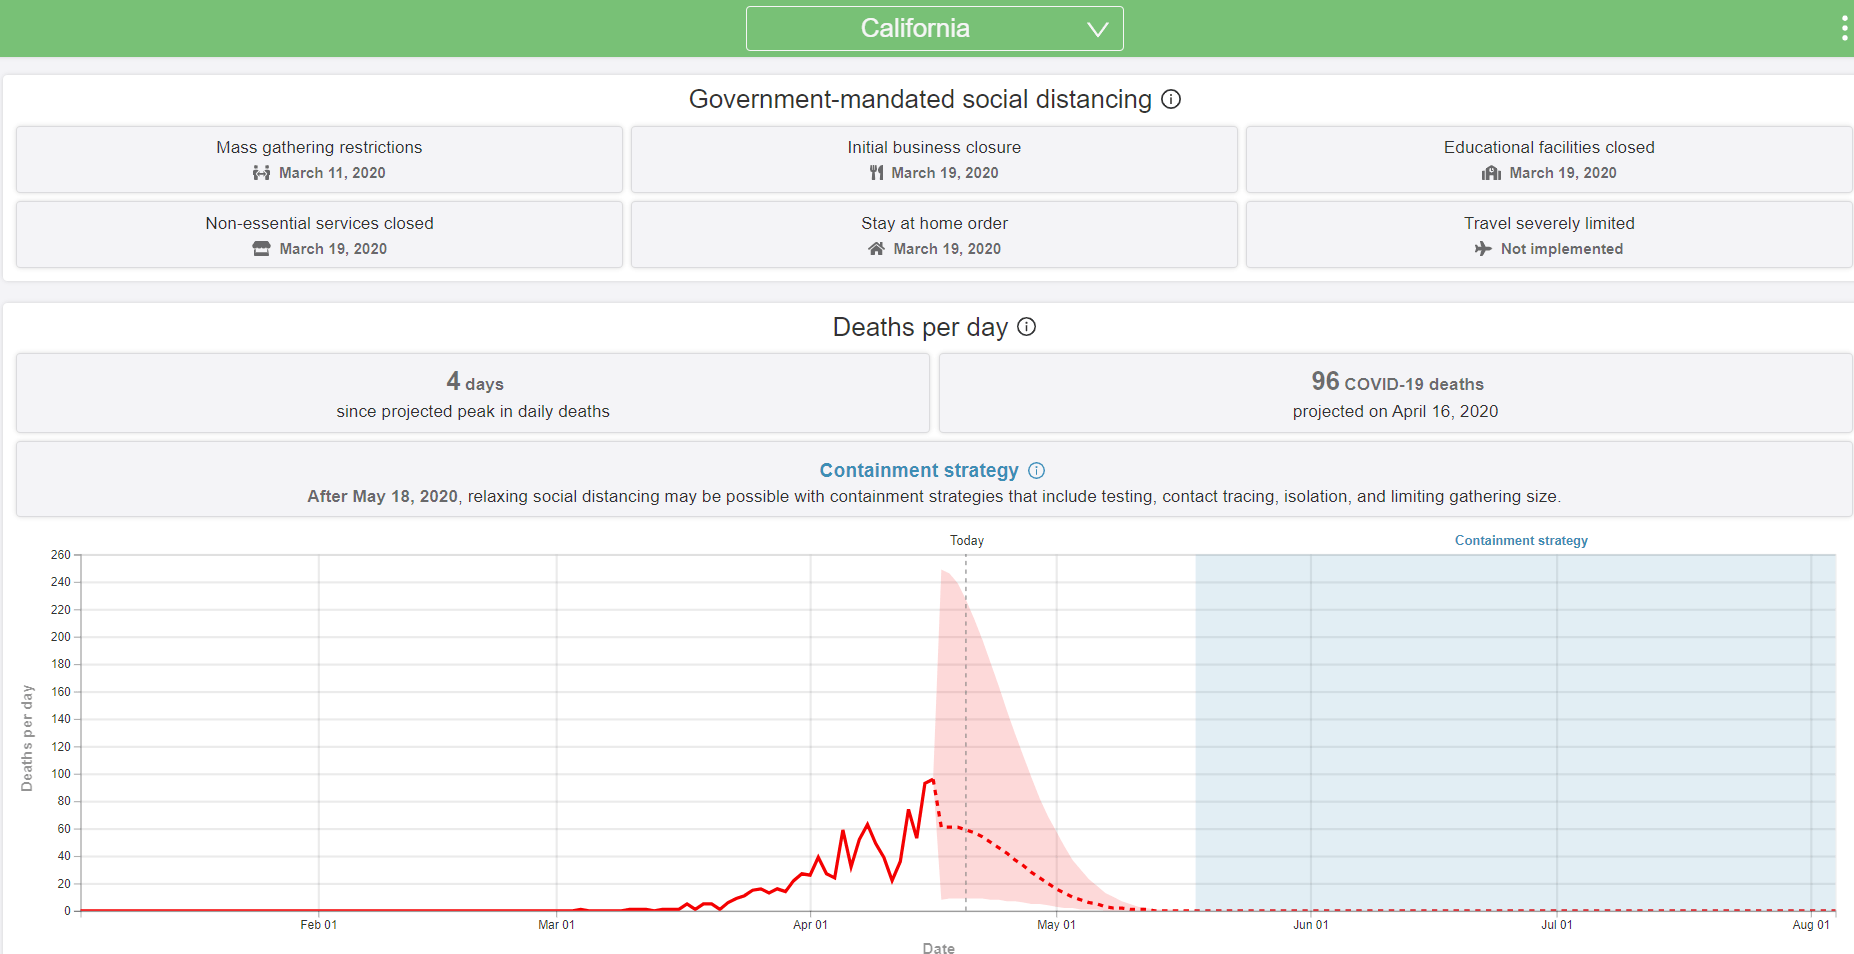
(Source: IHME)
The gold standard model for tracking this pandemic that the government has been using (at the Federal and state levels) is from the Institute for Health Metrics and Evaluation at the University of Washington.
That model gets around a lack of testing by tracking daily deaths and medical resource usage, which is the best we can do when the blue-chip expert consensus is that actual confirmed cases represent between 1% to 50% of actual infections (the median consensus is the US has 6 million actual infections).
The IHME has now applied the Federal guidelines (which state governors have said they will follow) to estimate when phase one might begin by each state.
The phase one date
refers to the timeframe when it may be possible to relax social distancing with containment strategies that include:
- Testing
- Contact tracing
- Isolation
- Limiting gathering size
The beginning of this timeframe is determined by our estimate of when COVID-19 infections drop below 1 per 1 million people in a given location, and is also influenced by each location’s available public health funding to implement new containment strategies.Infection rates are derived from our forecast of deaths.” – IHME (emphasis original)
Here are the estimated POTENTIAL phase 1 start dates for each state.
| State | Estimated Potential Phase 1 Restart |
| Hawaii | 5/4/2020 |
| Montana | 5/4/2020 |
| Vermont | 5/4/2020 |
| West Virginia | 5/4/2020 |
| New Hampshire | 5/11/2020 |
| Alaska | 5/11/2020 |
| Idaho | 5/11/2020 |
| North Carolina | 5/11/2020 |
| Wisconsin | 5/18/2020 |
| Alabama | 5/18/2020 |
| California | 5/18/2020 |
| Deleware | 5/18/2020 |
| Louisiana | 5/18/2020 |
| Michigan | 5/18/2020 |
| Nevada | 5/18/2020 |
| New Mexico | 5/18/2020 |
| Ohio | 5/18/2020 |
| Washington | 5/18/2020 |
| Oregon | 5/25/2020 |
| Wyoming | 5/25/2020 |
| Colorado | 5/25/2020 |
| Illinois | 5/25/2020 |
| Indiana | 5/25/2020 |
| Tennessee | 5/25/2020 |
| Minnesota | 5/25/2020 |
| Connecticut | 6/1/2020 |
| Florida | 6/1/2020 |
| Kansas | 6/1/2020 |
| Mississippi | 6/1/2020 |
| Missouri | 6/1/2020 |
| New Jersey | 6/1/2020 |
| New York | 6/1/2020 |
| Pennsylvania | 6/1/2020 |
| South Carolina | 6/1/2020 |
| Texas | 6/1/2020 |
| Arizona | 6/8/2020 |
| Washington DC | 6/8/2020 |
| Kentucky | 6/8/2020 |
| Maryland | 6/8/2020 |
| Massachusetts | 6/8/2020 |
| Rhode Island | 6/8/2020 |
| Virginia | 6/8/2020 |
| Georgia | 6/15/2020 |
| Oklahoma | 6/15/2020 |
| Utah | 6/15/2020 |
| Arkansas | 6/22/2020 |
| South Dakota | 6/22/2020 |
| Iowa | 6/29/2020 |
| Nebraska | 6/29/2020 |
| North Dakota | 6/29/2020 |
(Source: Institute for Health Metrics and Evaluation)
Here’s each state grouped by estimated POTENTIAL phase 1 dates.
5/4: HI, MT, VT, WV
5/11: NH, AK, ID, NC
5/18: WI, AL, CA, DE, LA, MI, NV, NM, OH, WA
5/25: OR, WY, CO, IL, IN, TN, MN
6/1: CT, FL, KS, MS, MO, NJ, NY, PA, SC, TX
6/8: AZ, DC, KY, MD, MA, RI, VA
6/15: GA, OK, UT
6/22: AR, SD
6/29: IA, NE, ND
The good news is that July 1st is the blue-chip economist consensus for when we need to have every state in phase one in order for the current economic models to have a reasonable chance of proving accurate.
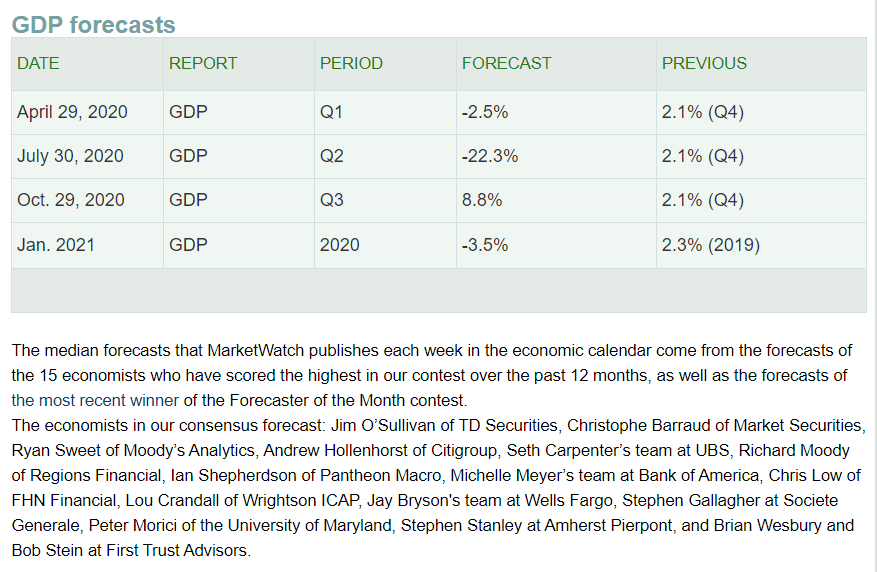
(Source: MarketWatch)
A sharp recovery in Q3 and beyond could mean that this recession lasts just four months, making the most severe and shortest in US history.
BUT that’s only if we are able to achieve the phase one time table laid out by the IHME model (which updates twice a week with the most recent data).
Testing Capacity Will Determine Whether We Can Achieve the Expected Timetable
The ability to adequately test in each state is what will determine whether or not we can begin phase one restarts in each state even IF the new daily cases fall to expected levels.
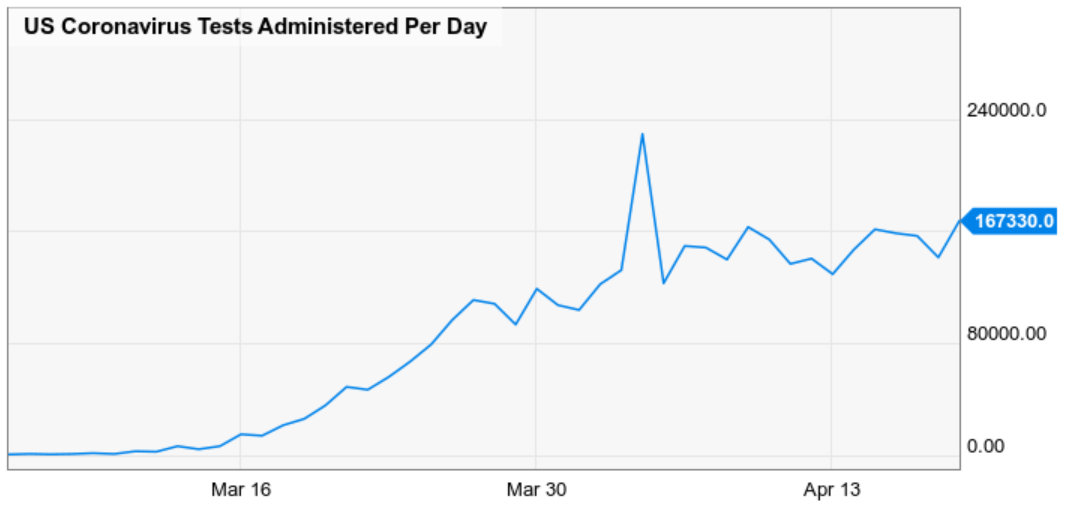
(Source: Ycharts)
Due to a lack of swabs, and other medical supplies and chemical reagents needed for testing, the US daily test count has been basically stuck at about 150K for weeks.
While estimates of how much testing capacity we need for phase one vary (from 300K per day to tens of millions per day) the expert consensus is about 300K to 500K, or 2X to 3X what we’re doing now.
The good news is that one of the bottlenecks, insufficient private lab testing (mostly state and CDC labs up until now) is easily fixed.
The bad news is that other bottlenecks, such as insufficient medical staff to do tests, and lack of swabs and protective gear (which must be disposed of after every test) is not so easily corrected.
Global supply chains have been badly disrupted and even the $30 billion testing funding that might be coming in the phase four stimulus might not quickly ramp up US testing capacity.
The expert consensus is that adequate testing is “weeks to months away”.
In other words, there is reason for hope, in that the US has hit peak daily new cases, and approximately on the IHME forecasted timeline.
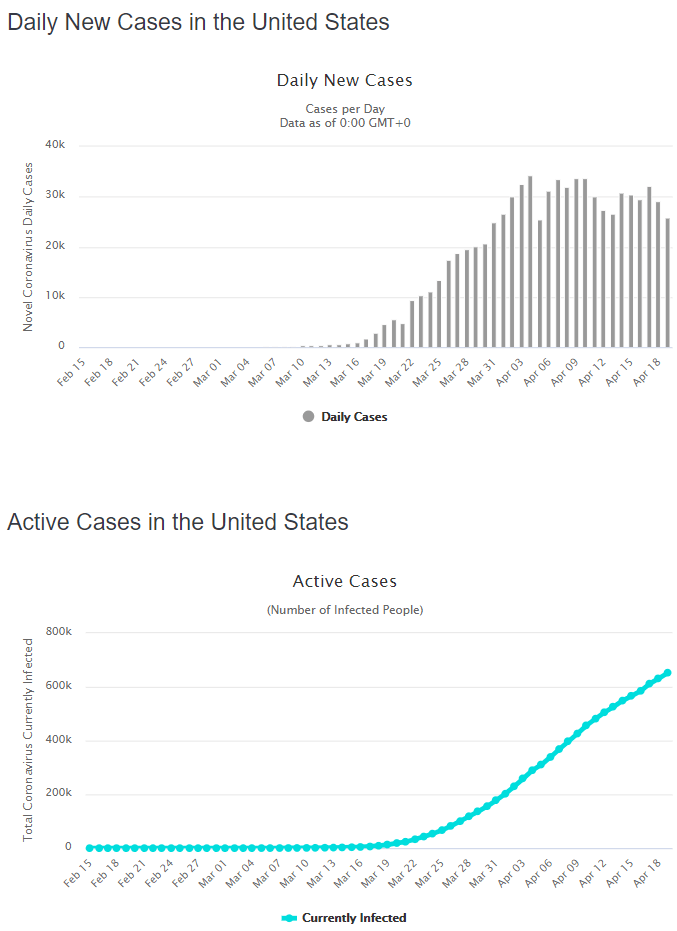
(Source: World Of Meters)
The bad news is that a lack of testing capacity means we might be stuck in a plateau for several weeks that makes phase one restarts impossible on the current forecasted time table. That could have dire implications for the economy and what the economic recovery will look like after this pandemic is over.
In part two of this report, I’ll explain what that might mean for your portfolio in the months ahead.
Want More Great Investing Ideas?
9 “BUY THE DIP” Growth Stocks for 2020
SPY shares were trading at $276.17 per share on Tuesday morning, down $5.42 (-1.92%). Year-to-date, SPY has declined -13.69%, versus a % rise in the benchmark S&P 500 index during the same period.
About the Author: Adam Galas

Adam has spent years as a writer for The Motley Fool, Simply Safe Dividends, Seeking Alpha, and Dividend Sensei. His goal is to help people learn how to harness the power of dividend growth investing. Learn more about Adam’s background, along with links to his most recent articles. More...
More Resources for the Stocks in this Article
| Ticker | POWR Rating | Industry Rank | Rank in Industry |
| SPY | Get Rating | Get Rating | Get Rating |


