

Thanks to the 4th escalation in the US/China trade war, the S&P 500 is off to its worst August start in 17 years. The August 1st “10% China Tariff” tweet, helped create a six-consecutive 6% losing streak, including the Monday 3% crash that was the worst day for stocks all year.
But while such high uncertainty and increasing downside volatility is upsetting to some, there are two reasons why it doesn’t bother me in the slightest. So read on to learn how I learned to stop worrying and love the trade war.
Trade War Increases Recession Risk…But Isn’t Likely to Actually Cause a Recession and Bear Market
There are numerous economic/recession risk models out there but for a reasonable real-time estimate of 12-month recession risk, I use the one created by the Cleveland Fed and Haver Analytics.
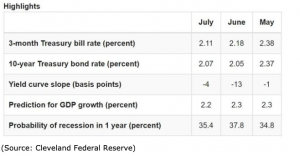
This is based on the 10y-3m yield curve which research from the Cleveland, St. Louis, San Francisco, Dallas, and New York Federal Reserves, indicate is the #1 or #2 most accurate recession forecasting tool we have.
The model is updated once per month (at the end of the month), and I calibrate my real-time recession risk model off the slope of the yield curve, and how it affects the probability of an economic downturn occurring within a year. Right now that model says that each 3.75 basis point greater inversion increases recession risk by about 1%. And given that the yield-curve is 30 basis points inverted as I write this, that implies a 42% risk of a recession beginning within a year.
That’s backed up by current real-time GDP growth models (7 of them) that estimate Q3 US growth of 1.9% (down from 2.9% in 2018, 3.1% in Q3, 2.1% in Q2).
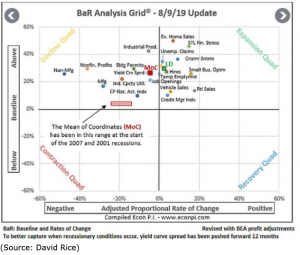
It’s also backed up by 19 leading economic indicators, which have predicted the last four recessions. The average or Mean of Coordinates of these economic reports, measured against their historical baseline, is how I personally tweak my monthly savings investments between stocks and cash/bonds. Currently, the MoC is 27.2% above baseline indicating very little risk that we’re in a recession or will experience one within a year (20% or lower above baseline is when recession risk is enough to cause me to go 100% into bonds with all fresh savings).
But what about those 10% tariffs going up on September 1st? Or the possibility of those going up to 25% later? According to Moody’s Analytics the probability of 10% tariffs going up and staying in place through the end of 2020 is 35%, with a 25% probability that the full 25% tariffs on all Chinese exports go into effect (just a 20% probability of a trade deal by the end of next year).
Aha! So couldn’t that plunge us into a recession quickly? That risk isn’t zero but Moody’s worst-case scenario (25% tariffs on all Chinese goods and 25% tariffs on EU auto parts) estimates peak US economic damage of -1.8% annually, by the end of 2020. That’s measured from 2018’s 2.9% growth, indicating that, if the trade war goes horribly wrong, next year’s growth might be 1% to 1.5%.
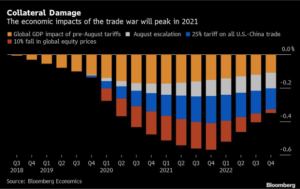
And Moody’s is the most pessimistic trade war damage model I’ve seen so far. Bloomberg estimates that full 25% tariffs on all Chinese imports would cause peak economic damage of about -0.6% per year to our growth rate. And that only happens by the end of Q4 2021, if those tariffs actually happen and stay in place the entire time.
And according to Moody’s, should the Fed cut rates eight times (to zero), that should boost US growth by about 1%, more than enough to offset the negative effects of the trade war. Which is why BNP Paribas chief U.S. economist Daniel Ahn estimates that “An additional 25 point rate cut from the Fed should be sufficient to offset an escalation even to the full 25% tariff rate on the remaining Chinese imports.”
The Fed is almost certain to cut at least once more, probably twice, meaning that we’re likely facing a 2016 like 1% to 1.5% growth rate next year. That might mean very weak (possibly flat) corporate earnings growth in 2019 and 2020, but it’s not likely to cause the typical 20% EPS crash seen in most recessions (which leads to an average 30% bear market).
It Creates Amazing Buying Opportunities for Top Quality Dividend Stocks
While the market, in general, isn’t likely set for a crash, plenty of trade/economically sensitive companies are already in bear markets. For example, MPLX (MPLX) is the high-yield deep value stock that I’ve been buying for the last three weeks, at steadily lower prices, allowing me to lock in a safe 9.8% yield that’s growing at 6.7% per year.
MPLX is suffering due to the market’s worry about the lowest natural gas prices in three years (lowest summer prices in 20 years). But this large MLP has 60% of its cash flow locked up under long-term and volume committed contracts with Marathon Petroleum (MPC), America’s largest independent refiner (BBB credit rating and soaring cash flows).
Weak natural gas liquids prices mean a potential 4% hit to cash flow this year, but MPLX’s distribution coverage ratio is a rock-solid 1.36 (1.2 or above is safe for self-funding MLPs like this). The MLP’s leverage is just 3.9, (compared to 4.1 industry norm) and well below the 5.0, that’s considered safe by credit rating agencies and bond investors.
The MLP is rapidly diversifying away from natural gas gathering in the Marcellus/Utica shale (most growth projects are focused on the Permian and oil projects), and it has almost $4 billion in liquidity under its two revolving credit facilities.
Basically, the market is likely very wrong about its current facts and reasoning on this 10% yielding safe MLP, creating the potential for modest 4% to 6% long-term cash flow growth to deliver 16% to 19% CAGR five-year total returns.
And if you want to invest your money into recession-resistant defensive names? Well then try out Altria (MO), which is going to be offering a 7.2% yield on today’s price when it next hikes its dividend 4% to 7% (any day now). That hike will mark Altria’s 50th consecutive year of dividend growth, adjusted for three spinoffs, and make it a de facto dividend king.
Altria is historically 64% less volatile than the S&P 500 (falls much less during most downturns), and realistic 4% to 9% long-term EPS and dividend growth (analysts expect 8% and management guidance 7% to 9%) means 14% to 22% CAGR 5-year total return potential from this defensive high-yield dividend king.
Bottom Line: The Trade War Is Just the Biggest Brick in the Wall of Worry That Stocks Will Climb Over on Their Way to Future Gains
Since 1950 the probability of the stock market declining 5% or more in a single month is 8%, meaning you should expect such declines, on average, once per year. Since 1945 the market has suffered a 5+% decline from an all-time high, on average, every six months, an average we’ve held to during the longest bull market in US history (14 pullbacks and five corrections).
In other words, the “crazy” volatility we’ve seen since the trade war kicked off in early 2018 is not crazy at all. It’s merely historically normal (2017’s volatility was the lowest in 50 years and the anomaly we shouldn’t expect to repeat).
Don’t get me wrong, I’m NOT a fan of the trade war, which is very likely hurting US and global economic growth and corporate earnings. Moody’s probability estimate of a 20% chance we get a trade deal by the end of next year seems reasonable, given how badly US/China trade relations have gotten.
However, while it’s the highest in 10 years, U.S. recession risk is still well below levels that indicate an economic contraction (and bear market) are likely. That’s not to say that slower growth in 2019 and 2020 won’t hurt corporate earnings, or cause the share prices of economically/trade-sensitive companies to languish.
But for anyone with a 3+ year time horizon, this also creates amazing opportunities to lock in attractive, safe and growing yields, as well as 15+% long-term CAGR total return potentials on quality companies.
That’s why I continue to steadily buy high-yield dividend stocks off the master Dividend Kings valuation/total return potential list (135 companies and counting) each week.
SPY shares were trading at $289.69 per share on Monday morning, down $1.93 (-0.66%). Year-to-date, SPY has gained 16.99%, versus a % rise in the benchmark S&P 500 index during the same period.
About the Author: Adam Galas

Adam has spent years as a writer for The Motley Fool, Simply Safe Dividends, Seeking Alpha, and Dividend Sensei. His goal is to help people learn how to harness the power of dividend growth investing. Learn more about Adam’s background, along with links to his most recent articles. More...
More Resources for the Stocks in this Article
| Ticker | POWR Rating | Industry Rank | Rank in Industry |
| SPY | Get Rating | Get Rating | Get Rating |


