

It seems like the stock market is made of Teflon, doesn’t it?
S&P & Top Performing Phoenix Portfolio Holdings Since March 23rd Lows
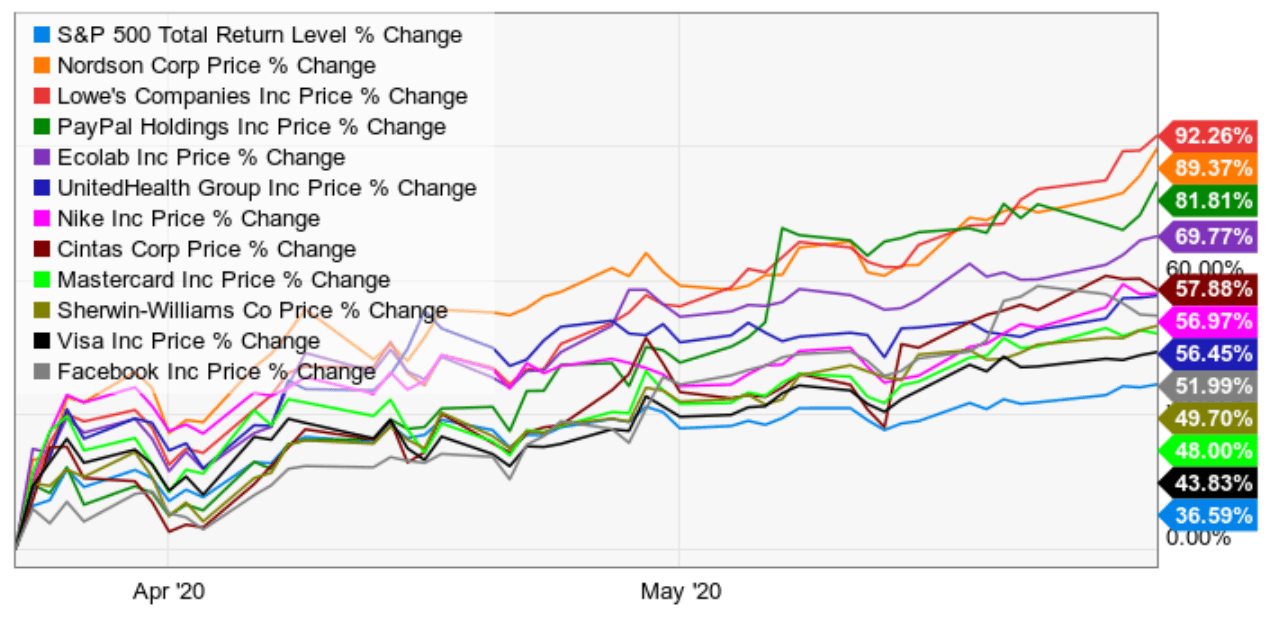
(Source: Ycharts)
From the bear market lows, the S&P 500 and other popular growth stocks, such as what the Dividend Kings’ Phoenix portfolio bought in late March, have been on an absolute tear.
Some analysts have dubbed this the “hopium” rally, and I tend to concur that the market has priced in the good news surrounding economic reopening, and then some.
However, I’m not a market timer, and there are good reasons that the market’s melt-up TINA/FOMO/QE Liquidity rally might keep rolling at least for the next few weeks, or potentially even months.
In this two-part series, I’ll first walk you through the reasons why the market may keep levitating higher, but why a painful decline is almost certainly inevitable.
I’ll then provide reasonable and prudent guidelines for how you can spare your retirement portfolio unnecessary pain and realized losses when the music finally stops, and the market inevitably succumbs to gravity.
Why Stocks Could Go As Much As 8% Higher From Here…
On March 19th, Barry Bannister and his team at Stifel declared the market oversold and predicted a recovery rally to 2,750 on the S&P 500.
Well, Stifel recently declared that rising optimism about economic reopening and record low-interest rates and historic levels of Fed liquidity injections could drive higher multiples through August.
Specifically, Stifel thinks stocks might climb as high as 3,250 or 3,300 by the end of Summer, as the market ignores the horrific earnings declines of 2020 to focus on the strongly expected recoveries incorporate fundamentals in 2021 and 2022.
I’ve already covered how America’s economic reopening is going so far and more recent data confirms that an “L-shaped” depression isn’t likely.
Goldman Sachs has also recently declared that it no longer believes a downturn could see stocks break below 2,750, meaning that even correction from the market’s 3,040 Friday close is unlikely.
And JPMorgan also recently penned a note outlining several reasons it believes stocks could have further to run.
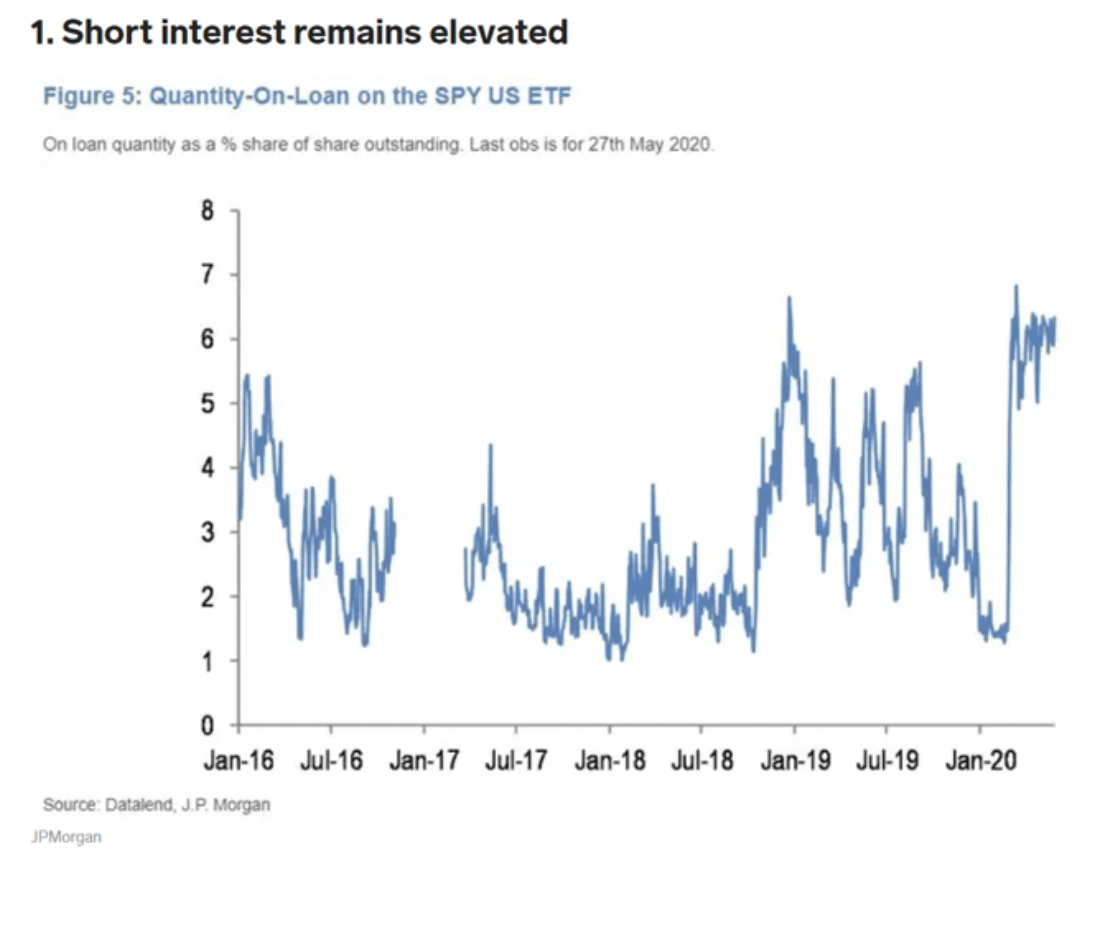
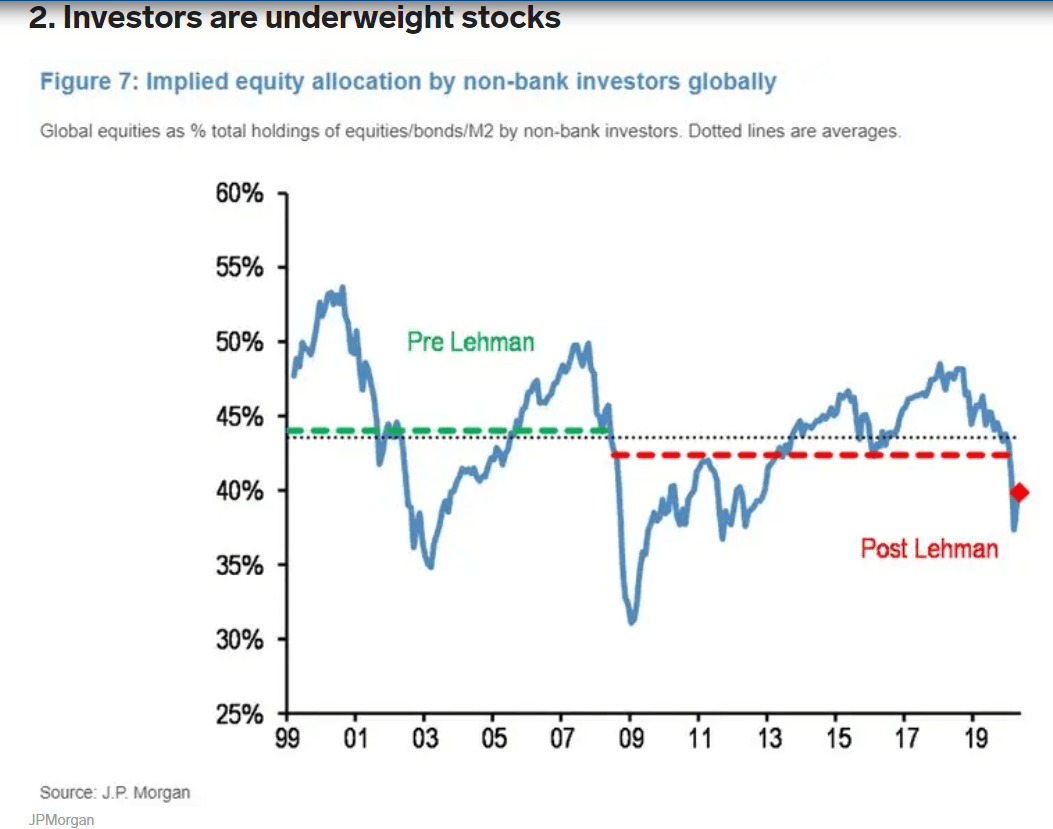
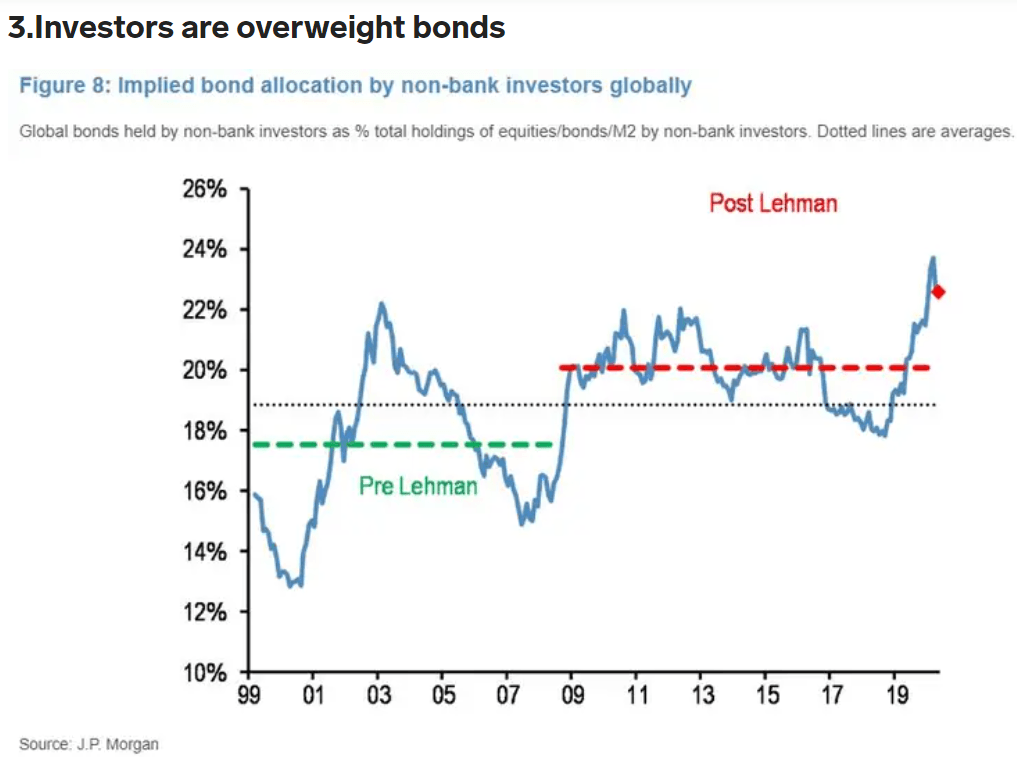
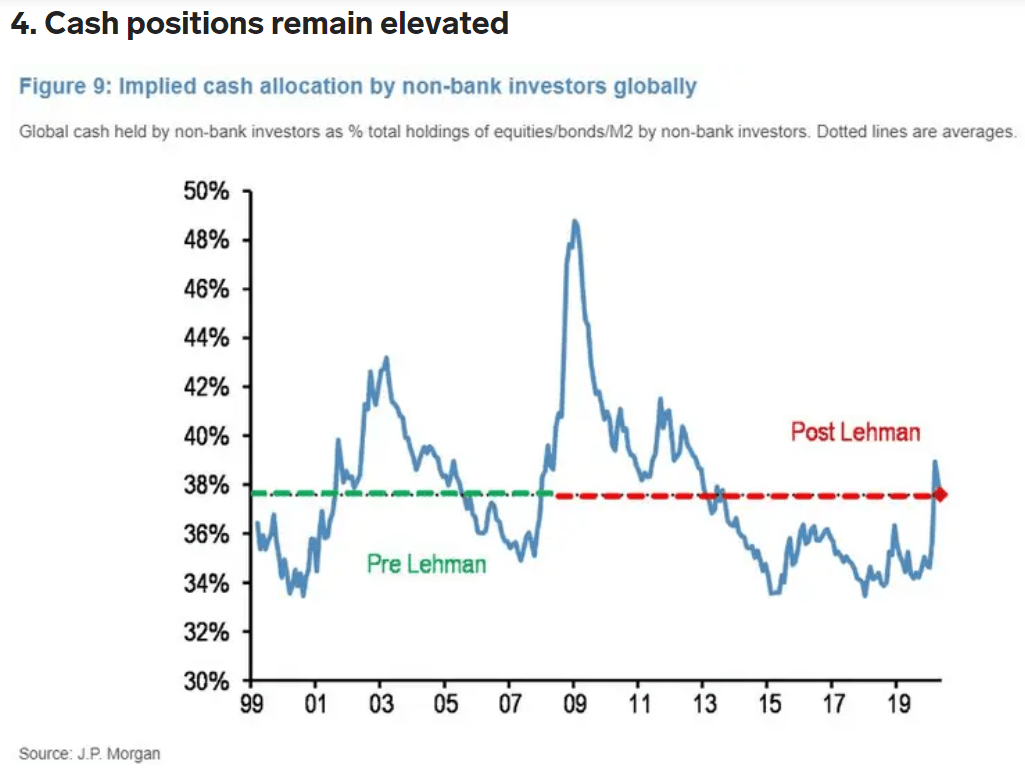
The bank said given cash yields are zero across the board for the foreseeable future, “it remains reasonable to expect this cash allocation to decline further over the medium to longer term.” – Business Insider
Now I will grant that Stifel, Goldman, and JPMorgan all make valid points, especially in regard to two factors in particular.
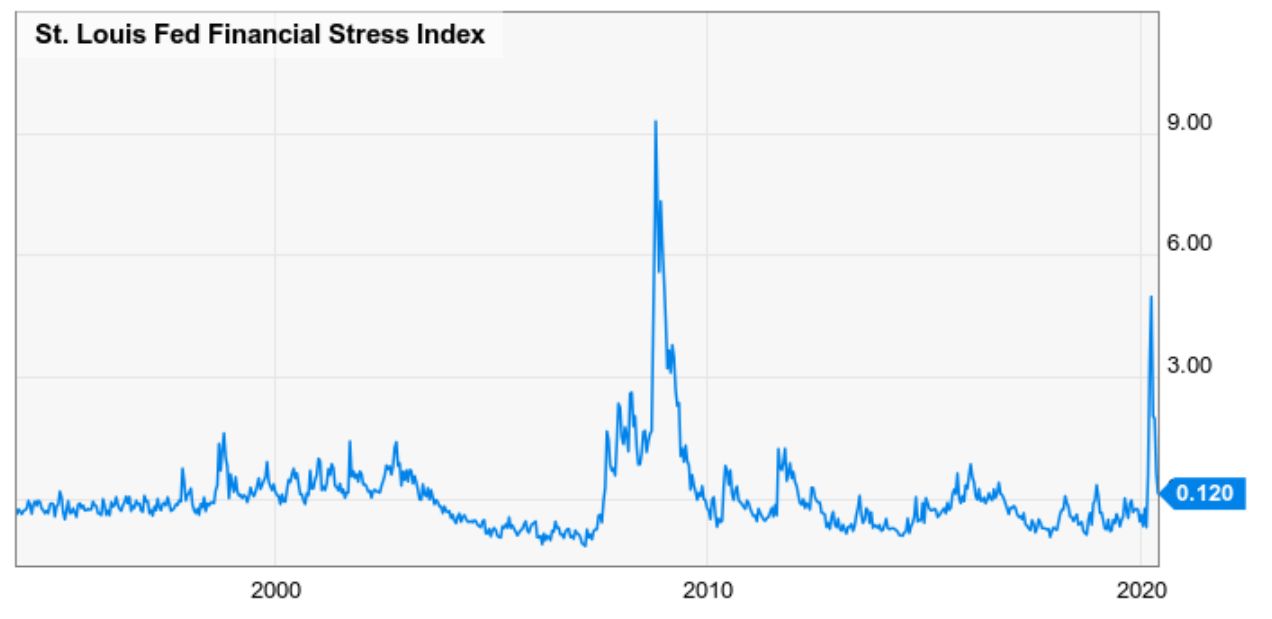
First, the levels of financial stress we’re seeing now have fallen to the average level seen since 1993, at least as measured by the St. Louis Fed Financial Stress Index.
(Source: Ycharts)
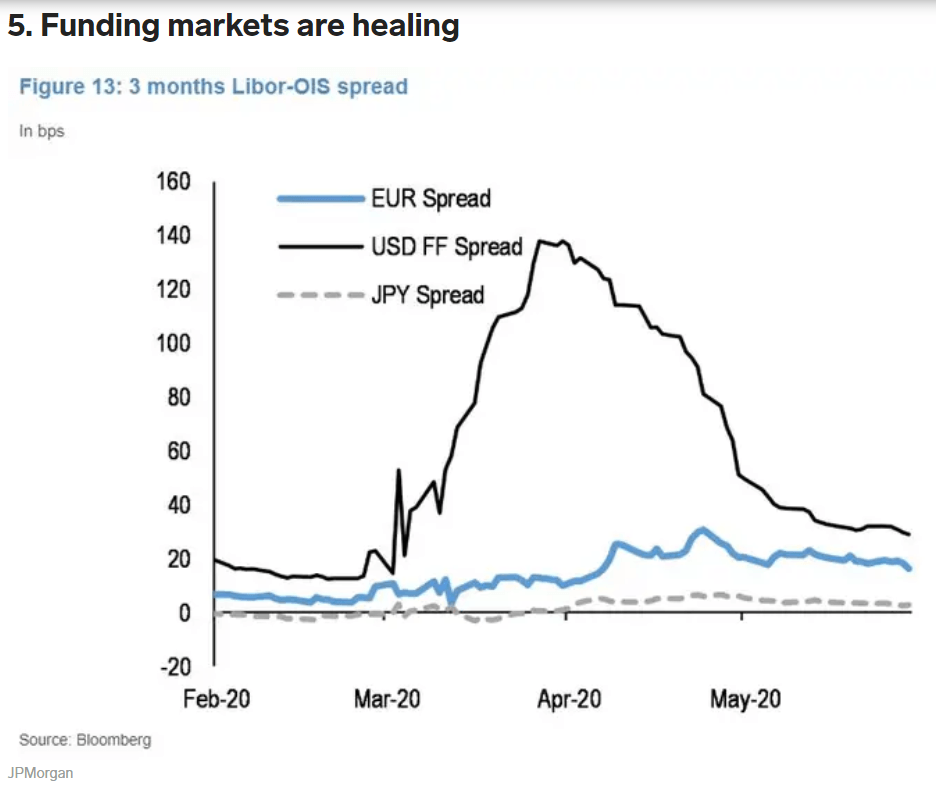
Despite the worst recession in 75 years raging all around us, the Fed’s $3+ trillion in liquidity injections (with another $3 to $4 trillion expected by the time this crisis is over) has caused corporate credit markets to become exceptionally liquid.
What about the TINA or “there is no alternative” concept that has long been heralded as the reason that “this time is different” and low-interest rates mean permanently higher stock multiples might last indefinitely?
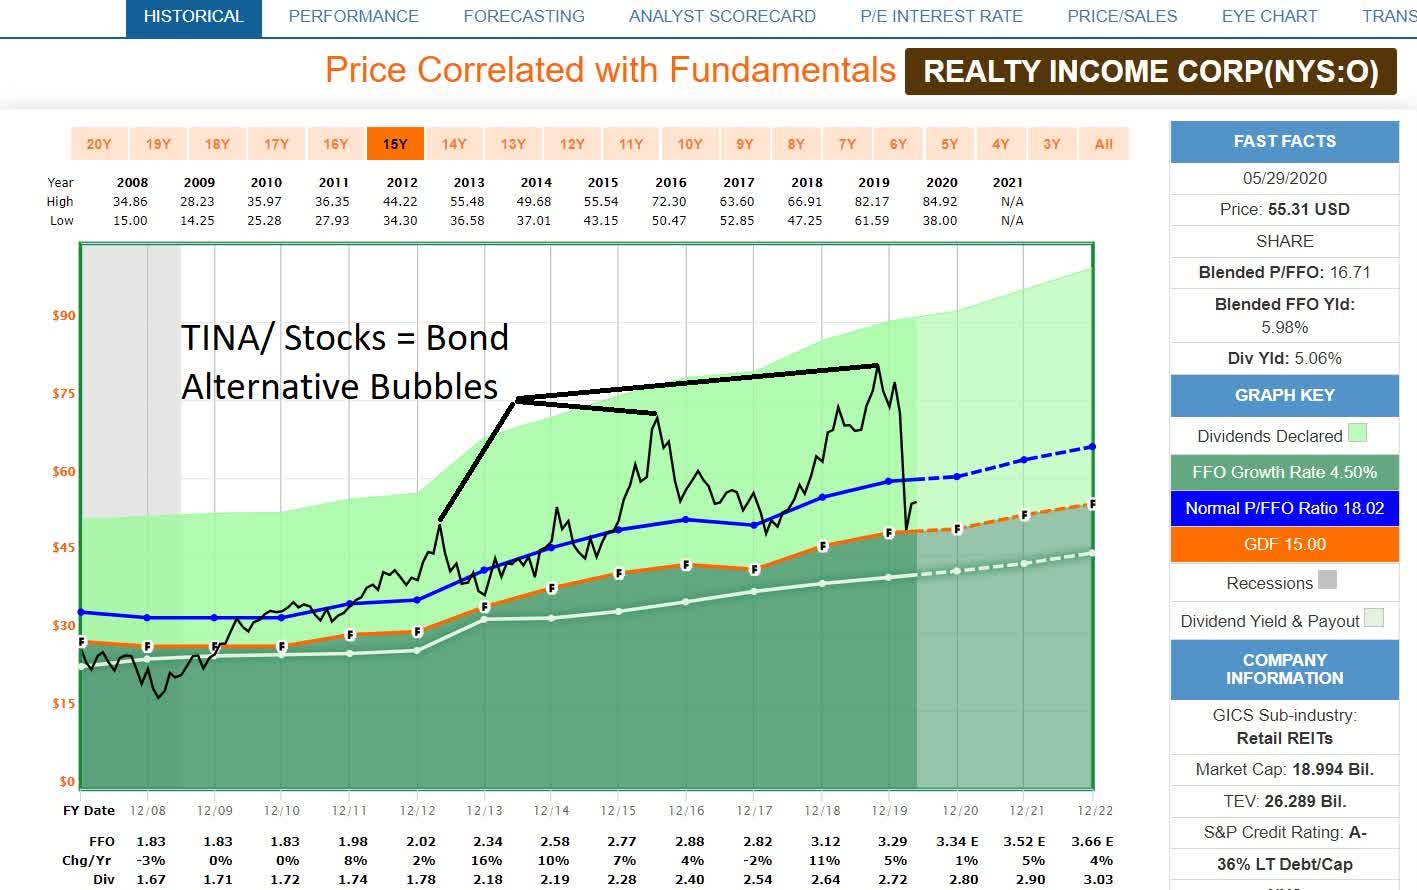
(Source: F.A.S.T Graphs, FactSet Research)– Realty Income is fairly valued at 18 to 19 FFO, not opinion, but objective market fact.
Such has been the rallying cry of REIT investors for much the past decade, for blue-chip favorites like Realty Income, whenever its P/FFO ratio surpassed 20.
Is there some truth to the idea that low rates forever MIGHT allow stock multiples to expand permanently or even keep rising for several more years?
In the shocking truth about interest rates, I pointed out two surprising facts that seem to justify this “stocks can go up forever” idea that is so popular these days.
The first surprising fact is that the long-term secular trend in interest rates is negative, and has been for about 700 years.
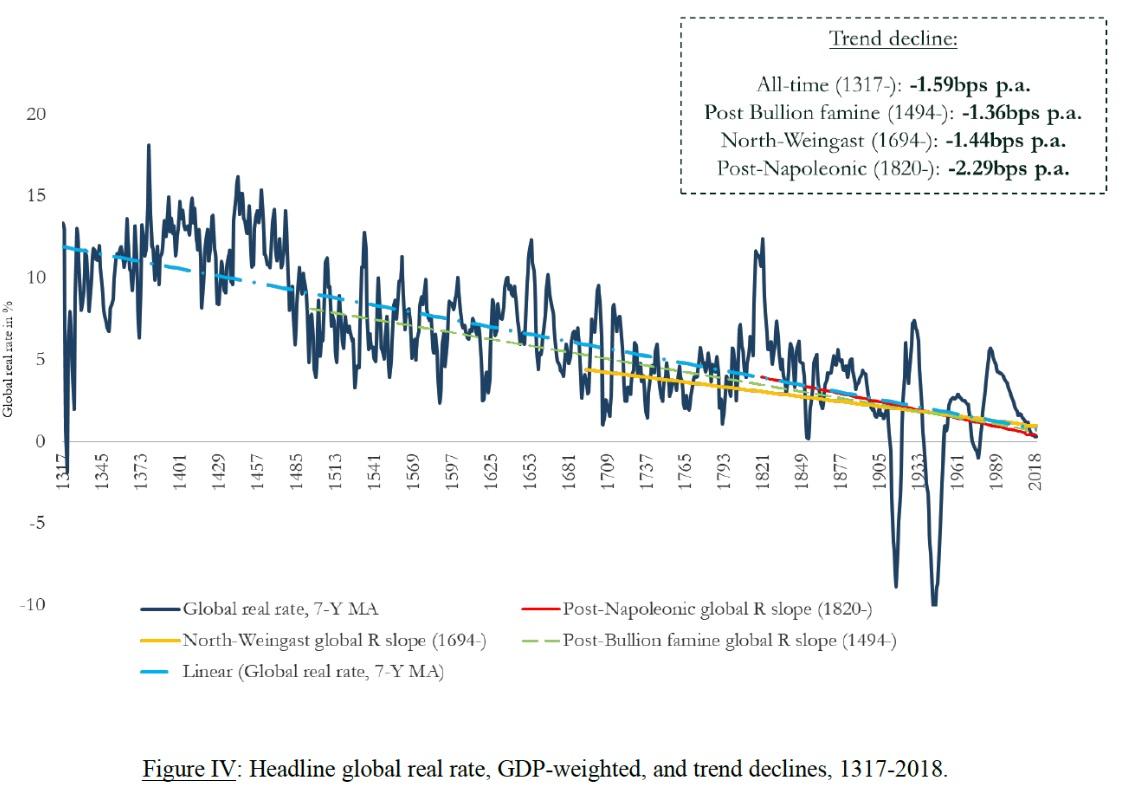
(Source: Bank of England)
As the world becomes wealthier and more productive, the natural cost of capital falls, especially as credit markets become global.
Second, and perhaps most important to the TINA true believers is the concept of earnings-yield risk premiums.
Since 2000 Goldman Sachs reports the earnings yield of the S&P 500 has been about 3.7% higher than 10-year Treasuries. This is the modern era historical risk-premium investors have demanded to own stocks vs risk-free US treasuries.
| 10-Year Yield | Theoretical “Fair Value Forward PE” For S&P 500 | Potential Decline Should Rates Ever Rise To 2.5% |
| 0.67% (today) | 22.9 | 29% (bear market) |
| 0% | 27.0 (Tech bubble highs) | 40% (severe bear market) |
| -1% | 37.0 | 56% (Great Recession Crash) |
| -2% | 58.8 | 72% (John Hussman prediction) |
| -3% | 143.9 (vs 1989 Japan bubble peak 90) | 89% (Great Depression Peak Decline) |
| -3.69% | 10,000 | 99.8% |
Theoretically, as long as long-term interest rates stay low enough forever, stock multiples could remain elevated far above their historical 16.35 25-year average.
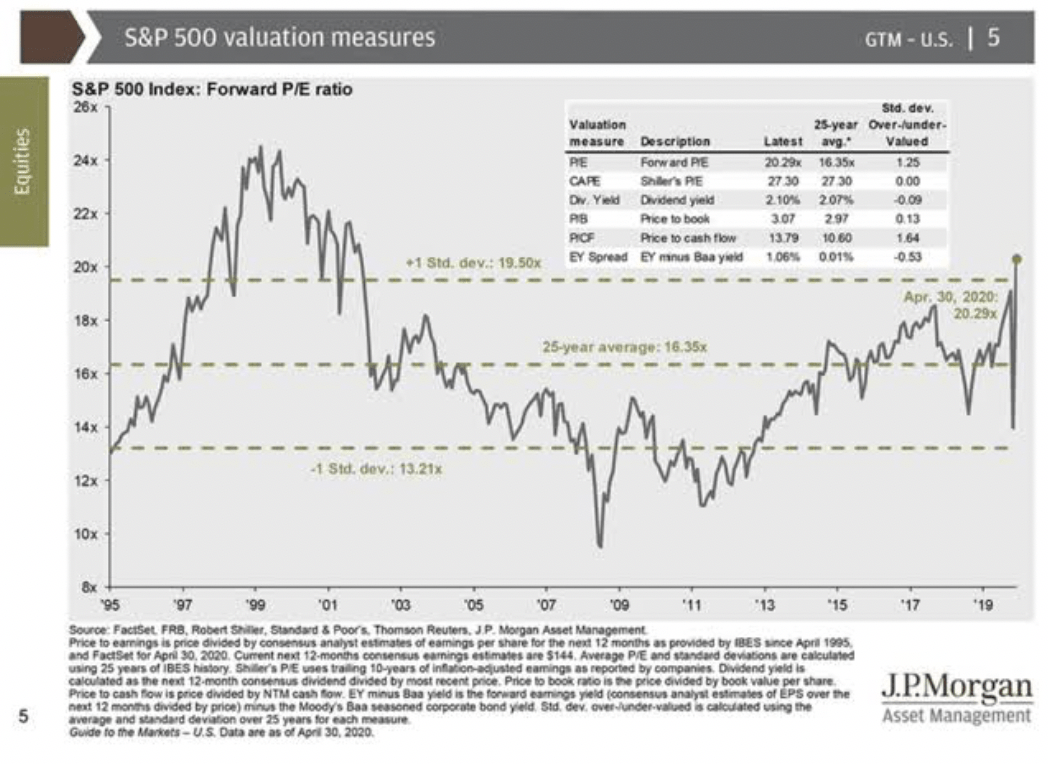
What’s more, there is nothing that says that even if rates rise, as they’ve been doing in recent days on rising economic optimism that the market can’t defy troubling economic and pandemic fundamentals and keep rising for weeks or even months longer.
…and Why Stocks Can’t Defy Gravity Forever
Research from JPMorgan, Bank of America and Princeton shows that
- over 12-months valuations/fundamentals explain just 9% of total returns
- over 5-years valuations/fundamentals explain 45% of total returns
- over 10+ years valuations/fundamentals explain 90% of total returns
This indeed bodes well for the increasingly bullish calls from analysts such as Stifel, Goldman, and JPMorgan, at least in the short-term.
However, the following table indicates that stocks will almost certainly have to return to something resembling modern era historical valuations sooner or later.
| Year | EPS Consensus | YOY Growth | Forward PE | Historical Overvaluation |
| 2020 | $125.24 | -23% | 24.4 | 49% |
| 2021 | $163.69 | 30% | 18.7 | 14% |
| 2022 | $186.58 | 13% | 16.4 | 0% |
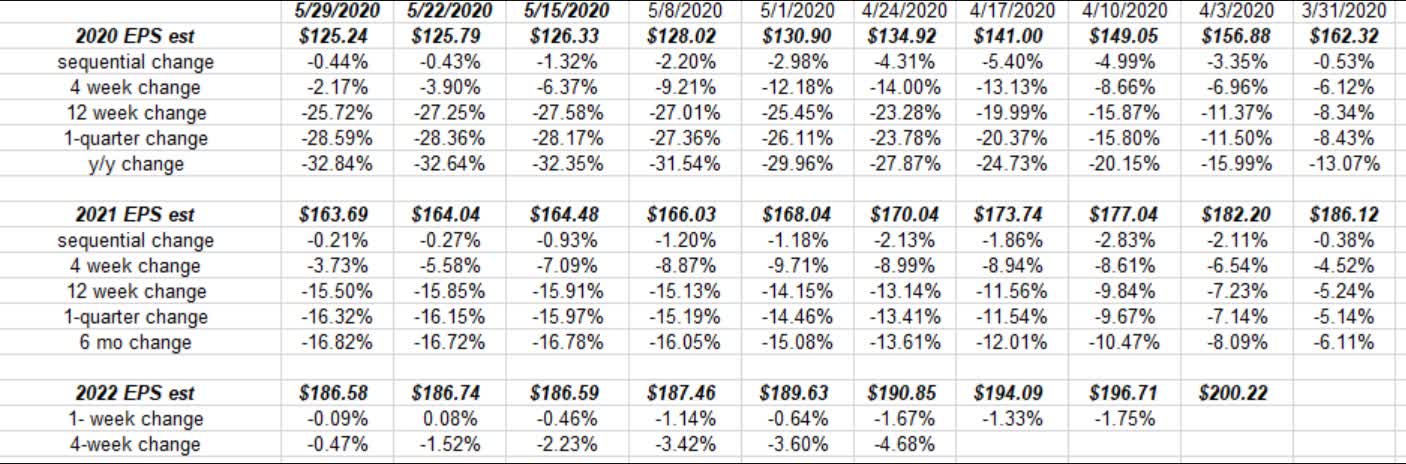
(Sources: Brian Gilmartin, IBES/Refinitiv/Reuters/Lipper Financial)
Even if you ignore the horrific and still falling 2020 EPS consensus estimates, stocks are already pricing in not just 2021’s gangbuster recovery earnings, but even 2022’s exceptionally strong expectations.
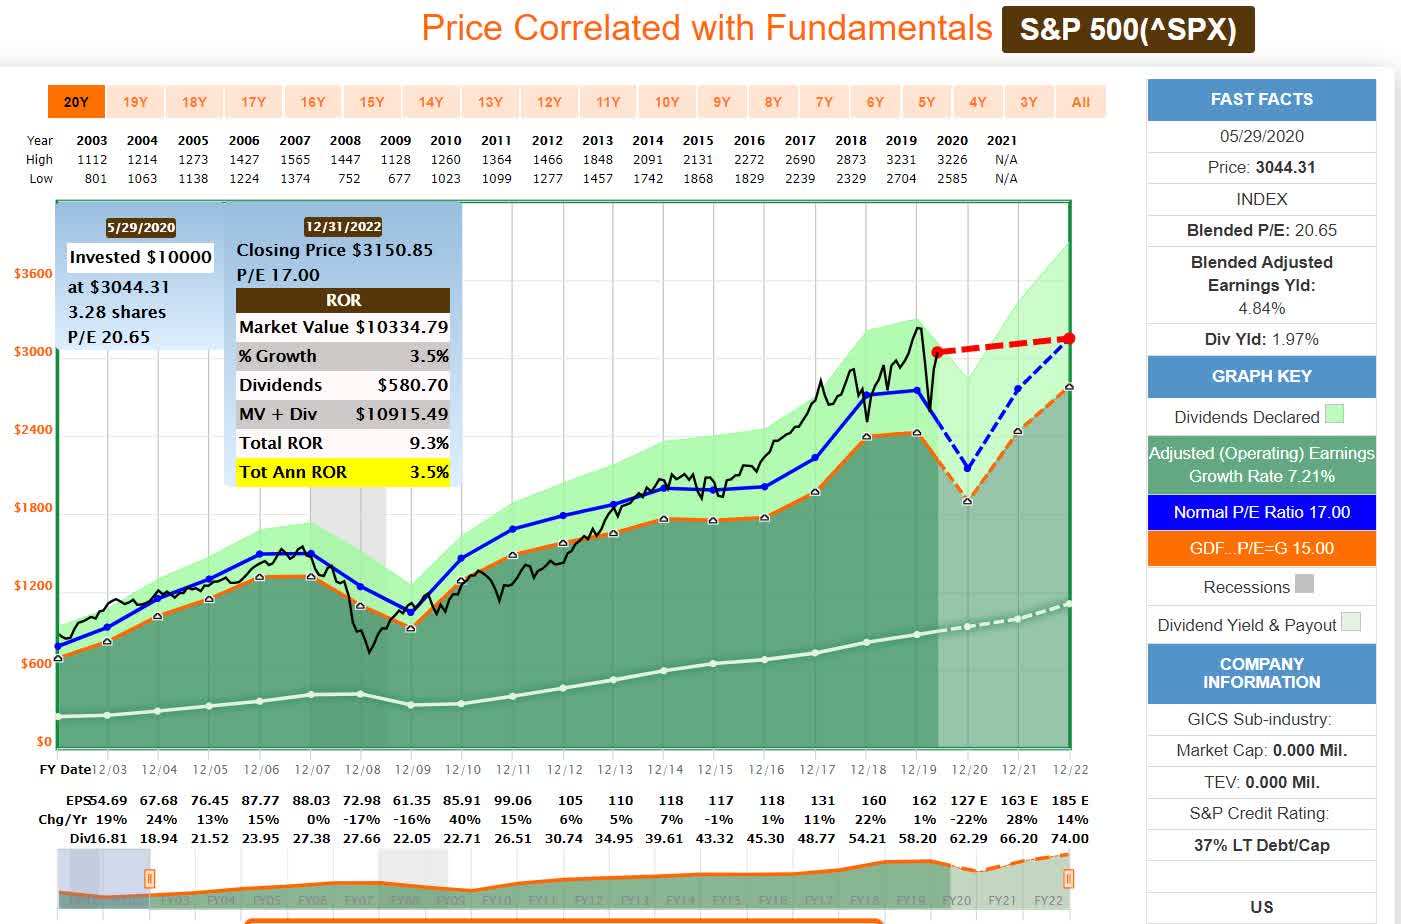
(Source: F.A.S.T Graphs, FactSet Research)
The 2022 consensus return potential as of Friday’s close was 3.5% CAGR through 2022 and if the market rises the 8% CAGR that Stifel says is possible, that return potential would fall to zero.
In other words, if stocks indeed go to 3,250 on SPY, then there will be flat return expectations for anyone buying the broader market over the next 2.5 years.
What if this time is different and a permanent era of ultra-low rates means that 20-year average valuations are no longer applicable? Over the past 20 years, the blended PE of the S&P 500 has averaged between 16.5 and 18.0 during periods of 4% to 11% CAGR earnings growth.
Perhaps if we only look at the last 11 years, since the era of QE forever and record low-interest rates and epic debt-funded buybacks we might see that the market’s historical multiples are much higher than in the past?
(Source: imgflip)
Even Ben Graham, the father of modern securities analysis and value investing admitted that the market is never wrong over the long-term.
The valuation/return data from JPMorgan, Bank of America, and Princeton seems to indicate that whatever multiples the market assigns stocks over 10+ years is valid.
So, let’s look at the last 11 years of the S&P 500’s earnings growth and blended PE, to see just how the modern era of buybacks and ultra-low rates and QE infinity has changed what real investors, risking real money, have deemed “fair value” for the S&P 500.
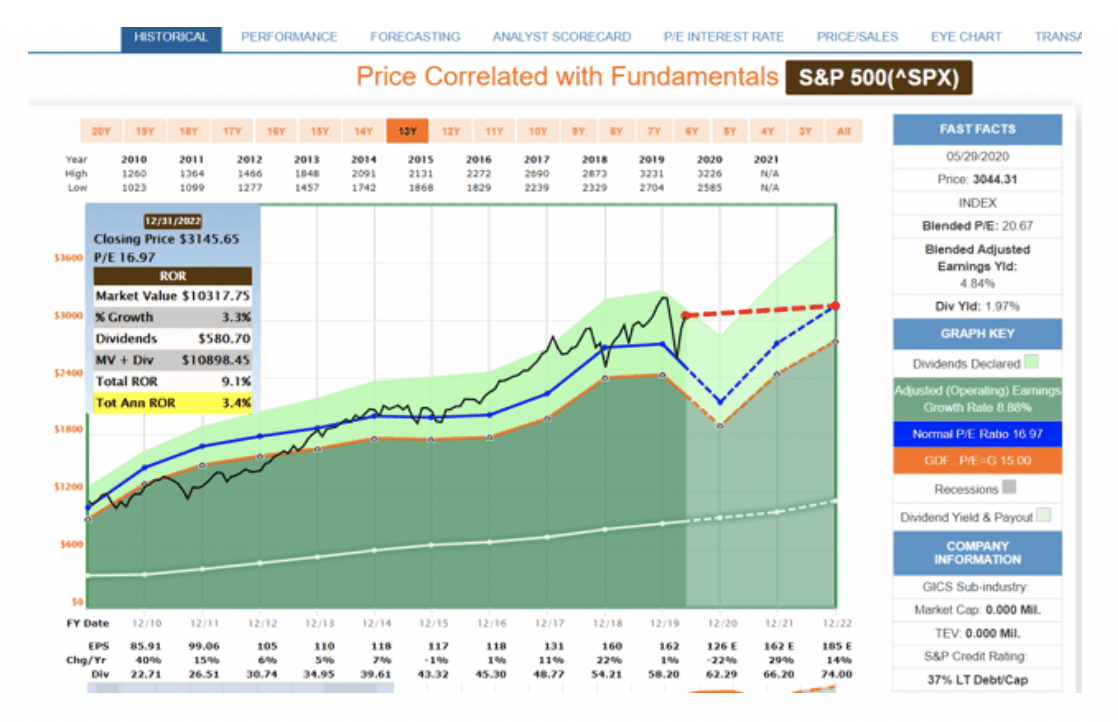
(Source: F.A.S.T Graphs, FactSet Research)
Since 2009, the age of ultra-low rates that are likely to persist for the foreseeable future and debt-funded M&A and buybacks fueling about 9% CAGR earnings growth, the S&P 500’s blended PE has averaged…17.0, the same as over the past 20 years.
Ok, but what about future earnings growth? Maybe that’s expected to speed up. After all, 29% EPS growth in 2021 and 14% in 2022 per the FactSet consensus is impressive, potentially indicating that faster growth might be in our future.
- FactSet long-term S&P EPS consensus: 8.5% CAGR
- FactSet’s John Butters reports that over the last 20 years analysts overestimate the S&P 500’s earnings growth by 1.8% to 3.8% per year, depending on whether we’re in a recession.
- 11-year EPS growth 8.9% CAGR is slightly above the current long-term consensus
The basic fundamentals, as best we can know them today, indicate that no significant multiple expansion is likely to take place in the future.
But what about ultra-low interest rates? If 10-year yields keep falling then 25, 30, and even greater PE multiples might be sustainable right?
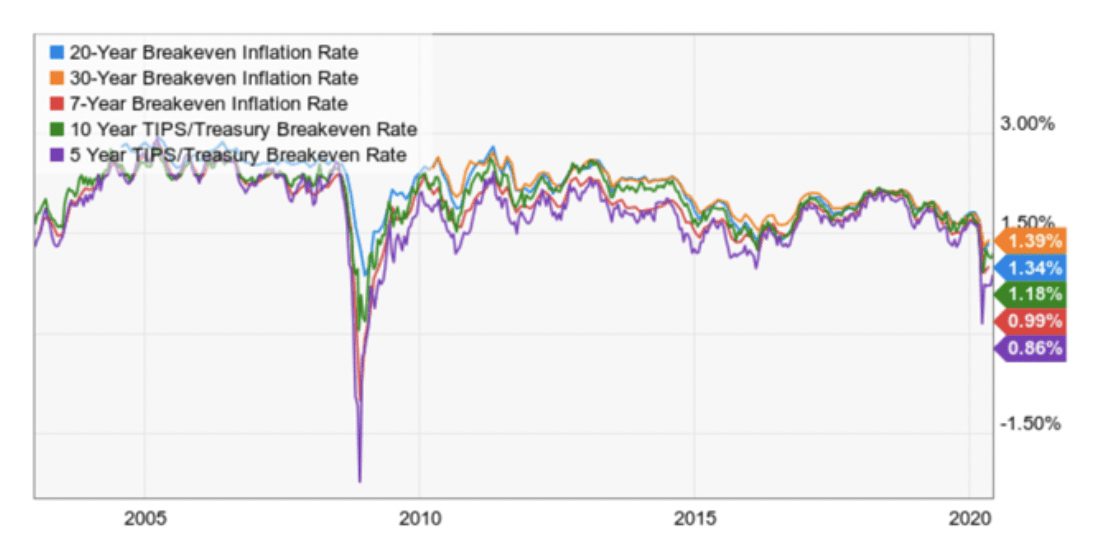
(Source: YCharts)
The Fed doesn’t control long-term interest rates, only the short-term rates via the Fed Funds rate.
Inflation expectations are the primary driver of long-term interest rates, what the stock market cares most about. It’s also what determines corporate borrowing costs to allow for debt-funded buybacks.
Right now, 5 to 30-year inflation expectations, as determined by the bond market, are between0.9% and 1.4%.
The Fed has said it plans to remain accommodative for as long as it takes for core PCE inflation to reach its 2.0% long-term target.
You can see in the above chart that during severe recessions, inflation expectations crash, but then tend to recover once the crisis has passed.
Inflation expectations rose as high as 2.75% in 2012, but even if they were to merely return to the Fed’s long-term target of 2% that would mean the 10-year yield would rise by about 0.8% to about 1.5%.
- 19.2 inflation-adjusted hypothetical “fair value” PE vs 24.4 right now
The very economic recovery that has the stock market so excited right now (in 2021 and beyond) could result in inflation-expectations rising to their former highs of 2.5% to 2.75%.
- Realistic upper bound on 10-year yield 3.17% to 3.42%
In other words, if the economy recovers, which is a pre-requisite for the kind of strong earnings growth Wall Street is currently pricing in and then some, then the theoretical justification for higher multiples vanishes.
- 17 blended PE, the 10 and 20-year average for S&P 500 implies a long-term 10-year yield of 2.12%
Basically, even if you look completely past this pandemic, which experts say is likely to last 18 to 24 months longer, there is no fundamental reason to believe that stocks can defy gravity forever and keep levitating higher.
In part two of this series, I’ll explain the reasonable and prudent way to use this “hopium” rally to protect your retirement portfolio from an inevitable market downturn.
Want More Great Investing Ideas?
9 “BUY THE DIP” Growth Stocks for 2020
What If I Am Wrong About the Bear Market? Even stubborn bears need to contemplate why the market continues to rally above 3,000.
7 “Safe-Haven” Dividend Stocks for Turbulent Times
SPY shares were trading at $311.73 per share on Wednesday morning, up $3.65 (+1.18%). Year-to-date, SPY has declined -2.58%, versus a % rise in the benchmark S&P 500 index during the same period.
About the Author: Adam Galas

Adam has spent years as a writer for The Motley Fool, Simply Safe Dividends, Seeking Alpha, and Dividend Sensei. His goal is to help people learn how to harness the power of dividend growth investing. Learn more about Adam’s background, along with links to his most recent articles. More...
More Resources for the Stocks in this Article
| Ticker | POWR Rating | Industry Rank | Rank in Industry |
| SPY | Get Rating | Get Rating | Get Rating |


