
We live in troubled and confusing times. Last week we had a lot of much better than expected economic news. How good? Well for one example August new housing starts rose 12% YOY, the strongest monthly gain in 12 years (expected to continue due to 10 years of underbuilding).
What’s more, industrial reports came in so much stronger than expected that the New York Fed’s real-time GDP tracker raised its Q3 2019 estimate from 1.6% to 2.2%, and elevated its Q4 2019 estimate from 1.1% to 2.0%.

(Source: NY Federal Reserve)
But then this week got started off on the wrong foot. IHS Markit’s Industrial Purchasing Manager Index or PMI, came in below expectations at 50.9, though this was the strongest showing in five months. Anything above 50 signifies expansion so at least it appears that US manufacturing isn’t falling off a cliff.
But more troubling is that the PMI for services (which accounts for 58% of the US economy) decreased to 49.1, the first indication of service contraction in 10 years. The good news was that overall service actively rose from 50.7 to 50.9 which IHS Chief Business Economist Chris Williamson explained basically means
The survey indicates that businesses continue to struggle against the headwinds of trade worries and elevated uncertainty about the outlook… Although picking up slightly, the overall rate of growth in September remained among the weakest since 2016.” -IHS
Naturally, many investors are worried that stocks being near record highs might mean we’re “due for a pullback/correction.” This might be for two reasons.
First, since early 2018, the market’s new record highs have averaged just 1.8% above the last record level before stocks took a tumble (though that’s mostly due to the trade war beginning in early 2018 and 5 escalations by our President every time the market reached a new all-time high).
Second, since 1945, we’ve averaged a 5% to 19.9% pullback/correction every six months, including during the current 10-year bull market.
In 2018 we had not one but two corrections, one at the start of the year, and one at the end.

(Source: Ycharts)
During late January and early February of last year, the S&P 500, Dow Jones Industrial Average and Nasdaq experienced one of the fastest corrections in market history, plunging 10% in a matter of a few days. That correction proved far milder (stocks were back to record highs within three months) than the late 2018 correction, the worst in 10 years. In the final three weeks of that stock slide, the market collapsed 17% withing three weeks, after a rollercoaster three month period.
But then after bottoming on December 24th, 2018 stock kicked off 2019 with the strongest Q1 rally in 32 years, and are now up about 20% YTD. That’s despite the trade war getting worse, and the economic outlook darkening a lot since late 2018.
Which begs the questions of whether or not stocks are overvalued today, by how much, and how likely are we to suffer another pullback/correction in the near-term?
To help answer these questions, and help you plan your portfolio’s management better, let’s take a look at how to broadly evaluate the market’s valuation, and most importantly how to use that information to make better long-term investment decisions with your hard-earned money.
How to Determine Whether the Stock Market is Overvalued
There are dozens of possible metrics you can measure the market’s valuation with, some well known (like PE or CAPE) and some not (Tobin Q, Buffet’s market cap/GDP).

Depending on which metric you look at, and on what time scale, you might think the market is headed for a crash (using CAPE since 1871) or potentially stocks are still undervalued (based on earnings yield minus 10-year Treasury yield).
I personally use the forward PE ratio on the S&P 500 as my proxy for the broader market. Why?
- PE ratio is by far the most popular valuation metric used on the street (if you use something no one pays attention to it’s not likely to work)
- The S&P 500 overlaps with enough of the Nasdaq and DJIA that when the S&P 500 is over/undervalued those indexes tend to be as well
- We have a lot of historical data about S&P 500 PE ratios over time
But even once you determine what metric to use, you need to decide on what time frames and what cutoffs determine “over and undervalued”.
I consider the 25-year average forward PE of 16.2 to be a reasonable estimate of fair market value. It incorporates enough economic and interest rate conditions, as well as valuation ranges (dirt cheap in 2009 to insanely high in 2000) to provide a good approximation of how stocks are trading in our modern era.
| Market Classification | Forward PE |
| Reasonable Buy | near 16.6 (5-year average) |
| Good buy | near 16.2 (25-year average) |
| Strong Buy | near 14.8 (10-year average) |
| Very Strong Buy | near 13.5 (associated with non-financial crisis recession lows) |
(Sources: JPMorgan Asset Management, FactSet Research, Moon Capital Management, NBER, Multiple.com)
Specifically, here are the forward PE ratios for the S&P 500 that I consider reasonable to very strong buys. By “near” I mean within 0.1 to 0.2, you don’t have to obsess over exact figures. Don’t forget that forward estimates will vary a bit depending on what data source you’re using. FactSet’s consensus is for $173 in EPS over the next 12 months while other sources, such as Reuters, estimate $171.
I am splitting the difference and using $172 in S&P forward EPS to estimate the S&P 500 is 17.4 (S&P 500 is at 2,997 as I write this).
So with the market now about 7% historically overvalued, does that mean it’s time to sell all your stocks? Not at all. Remember that market timing is all but impossible to do consistently over time. And that’s even for experts.
Sure, it’d be great to get out of stocks at the high and jump back in at the low, but in 55 years in the business, I not only have never met anybody who knew how to do it, I’ve never met anybody who had met anybody who knew how to do it.” – Vanguard Founder John Bogle
How do regular investors, who lack the expertise and supercomputing power that fails even Wall Street’s best and brightest (or at least highest paid) do when they try timing the market?
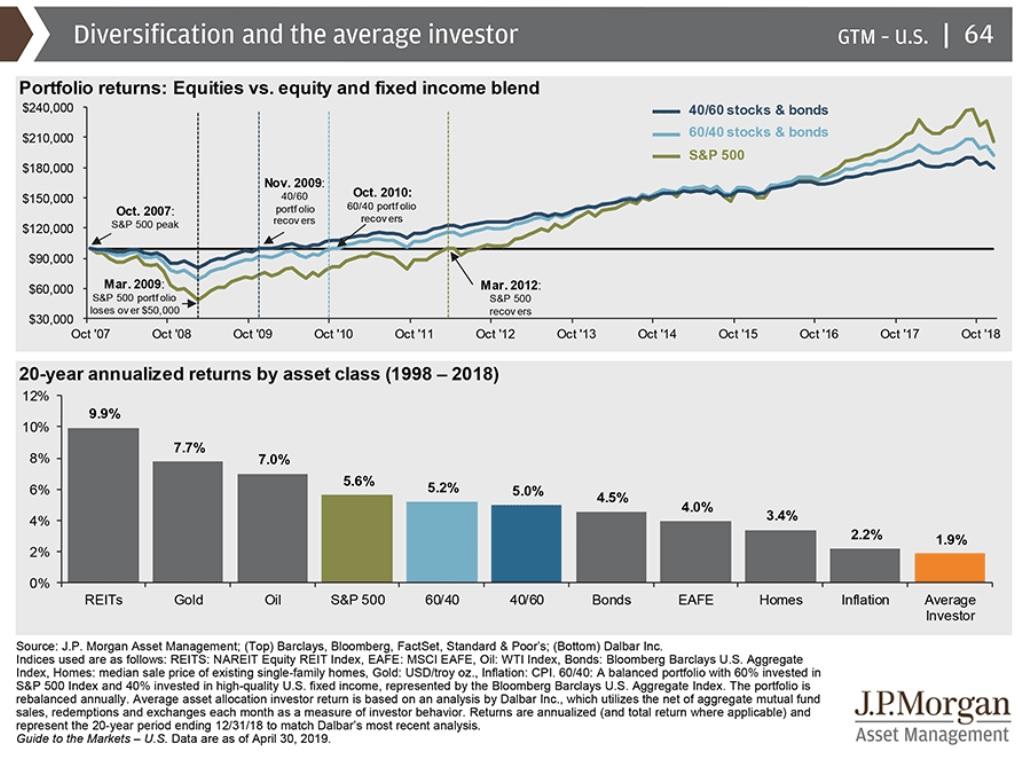 Try losing to every single asset class, including bonds, and even a conservative 40/60 bond/stock balanced portfolio. Heck, in the past 20 years market timing retail investors even lost to inflation, over half an investing lifetime.
So here’s a reasonable and prudent way to put your savings to work when the market is trading at today’s slight premium.
How to Use This Information to Make Smarter Long-Term Decisions With Your Savings
A reasonable and prudent approach to marginal (new money only) capital allocation depends on your investing style. If you want to be as hands-off as possible and like a broad index like the S&P 500 (through ETFs like VOO), then you can apply a sliding scale like this one.
- 17.5+ forward PE: 0% of monthly savings into S&P 500 and 100% into cash equivalent
- 17.1 to 17.4 forward PE: 25% of monthly savings into S&P 500, 75% into MINT (cash equivalent)
- 16.6 to 17.0 forward PE: 50% of monthly savings into S&P 500, 50% into cash equivalent
- 16.2 to 16.5 forward PE: 75% of monthly savings into S&P 500, 25% into cash equivalent
- 16.1 or lower: 100% of monthly savings into S&P 500, 0% into cash equivalent
The idea is to store up buying power, via a cash equivalent ultra-short-duration bond ETF (MINT yields 2.8% after expenses) which will get deployed during one of the market’s future (and frequent) pullbacks.
You can tweak your scale to fit your needs, I merely off the above cutoffs as examples.
Another way you can keep putting money to work if you haven’t the experience/time/interest in active stock picking is by targeting undervalued sectors.

(Source: FactSet Research)
Right now financials (including big banks who have fortress balance sheets, rising profit margins, and record earnings) are trading at below their 10-year average sector PE ratio.
If we avoid recession (60% probability according to the yield-curve and confirmed by the latest economic data) banks are likely to significantly outperform over the next 12 to 24 months from current prices. It doesn’t hurt that some are buying back up to 12% of shares each year driving up to 15% EPS growth.
Industrials and healthcare are not as undervalued as financials but are still trading below five-year sector average PEs.
- financials: XLF
- industrials: XLI
- healthcare: XLV
Here are some low-cost sector ETFs you can consider, that can help you put money to work in the best sector valuations right now.
Sectors go in and out of favor and this is an approach my friend has used to good effect, for 25% of his portfolio (he uses my sliding scale idea for 50% that goes into the S&P 500). The rest he puts into individual stocks (he’s a big fan of tech).
And of course, we can’t forget that as my fellow Dividend King founder Chuck Carnevale says “it’s a market of stocks, not a stock market.”
No matter how crazy the market’s valuations get, something good is always on sale. For example, at the peak of the tech bubble, in April 2000, the forward PE on the S&P 500 hit an all-time high of 27.2.
You might think “surely nothing was on sale then.” In reality Realty Income (O), one of the highest-quality dividend growth stocks in the world, hit 11% yield and just 7 times cash flow.

(Source: Ycharts)
Realty Income’s historical price to cash flow (REIT equivalent of a PE ratio) at the time was about 15. What did Realty, trading at such an absurd valuation do during the tech crash?
In early 2000, after a multi-year value bear market (even Berkshire fell 50%) some investors might have thought “if Realty is crashing this much during the greatest bull market in history, then imagine how much it will drop in a recession/bear market?”

(Source: Ycharts)
Here is how Realty and Altria (MO) which was also trading at some of its most undervalued levels in history at the time, did during the next three years. Despite a recession and the Nasdaq falling 80% at one point (S&P 500 50%) both stocks more than doubled.
Today Realty is overvalued so don’t buy it. But Altria? The best stock in US history (20% CAGR total returns over 55 years) is once more trading at absurd valuations, including
- safe 8.2% yield (only been higher 3% of the time in the past 25 years)
- about 10 times 2019 earnings (9 times 2020 earnings) – vs historical 16.4
- 15% to 26% CAGR long-term total return potential (in-line with its historical Buffett beating track record)
Now don’t get me wrong, I’m not saying that Altria is likely to go up during a bear market (caused by a future recession). I am saying that this is a fantastic long-term ultra-high-yield opportunity (and my highest conviction buy right now). Altria’s defensive business model, low historical volatility (65% less volatile than S&P 500 over the past 33 years) and today’s sensationally low price, means it’s very likely to outperform the slightly overvalued market during future corrections.
Bottom Line: Knowing When It’s Time To Tweak What You Buy Can Boost Your Long-Term Returns And Help Achieve Your Financial Goals
I’m not a market timer and can’t tell you what a 17.4 forward PE on the S&P 500 means for stocks over the next week or month. Historical valuation comparisons can merely provide a rough guide for what’s likely to happen based on the past.
From current valuations, and given the current economic fundamentals and recent trends, caution appears warranted. Those seeking to buy primarily broad-based index funds, like the S&P 500, DJIA or Nasdaq, might want to lighten up monthly savings, to store up dry powder (in the form of cash equivalents and or medium-duration bonds) because we’ll likely have another pullback within about four to five months.
The trade talks in October are the most likely catalyst for a decline in the broader market, given that Moody’s estimates just a 15% probability of an interim deal that reduces US tariffs on Chinese imports and thus reduces recession risk.
The good news is that you don’t have to stop putting new money to work entirely because
- sectors like financials are trading at very attractive historical levels and will likely outperform should we avoid a recession (60% probability of that according to the yield curve)
- quality individual stocks are always on sale, no matter how overvalued the broader market gets
I personally recommend adopting a sliding scale approach, that follows reasonable valuation guidelines for your individual needs.
For example, with 12-month recession risk currently 40% and the average of 19 leading indicators 23.9% above historical baseline, I’m putting 40% of monthly savings into stocks (currently buying deep value defensive names like Altria). The rest is going into bonds, diversified across the duration spectrum.
This provides a low-cost hedge against potential recession in 2020 or 2021 should the trade war get worse, but allows me to put a lot of money to work in fantastic opportunities that are all around us. During a recession, when stocks would almost certainly fall into a bear market, I’d sell my bonds at a profit to rotate into top-quality dividend stocks at the best valuations in over 10 years.
One of my friends is using my sliding scale approach to tweak his monthly investments in the S&P 500 (via the ETF VOO) which is where 50% of his savings go over time. But when valuations get stretched, then he pulls back and favors short-term bonds like the ETF MINT, which yields 2.8% after expenses, and trades flat as a pancake during nearly all market conditions.
That’s what he uses to load up when the market becomes historically undervalued. For the 50% of cash not slated for the S&P 500, he buys sector ETFs (REITs back in early 2018 and financials today, industrials back in August) and opportunistically buys FAANG tech stocks.
I consider such a tactical strategy for new money (don’t touch what you own as long as the thesis is intact) is a good way of minimizing regret, by balancing the need for dry powder during market declines, with the fact that time in the market is far more effective than market timing.
SPY shares were trading at $295.05 per share on Wednesday morning, down $0.82 (-0.28%). Year-to-date, SPY has gained 19.70%, versus a % rise in the benchmark S&P 500 index during the same period.
About the Author: Adam Galas

Adam has spent years as a writer for The Motley Fool, Simply Safe Dividends, Seeking Alpha, and Dividend Sensei. His goal is to help people learn how to harness the power of dividend growth investing. Learn more about Adam’s background, along with links to his most recent articles. More...
More Resources for the Stocks in this Article
| Ticker | POWR Rating | Industry Rank | Rank in Industry |
| SPY | Get Rating | Get Rating | Get Rating |


