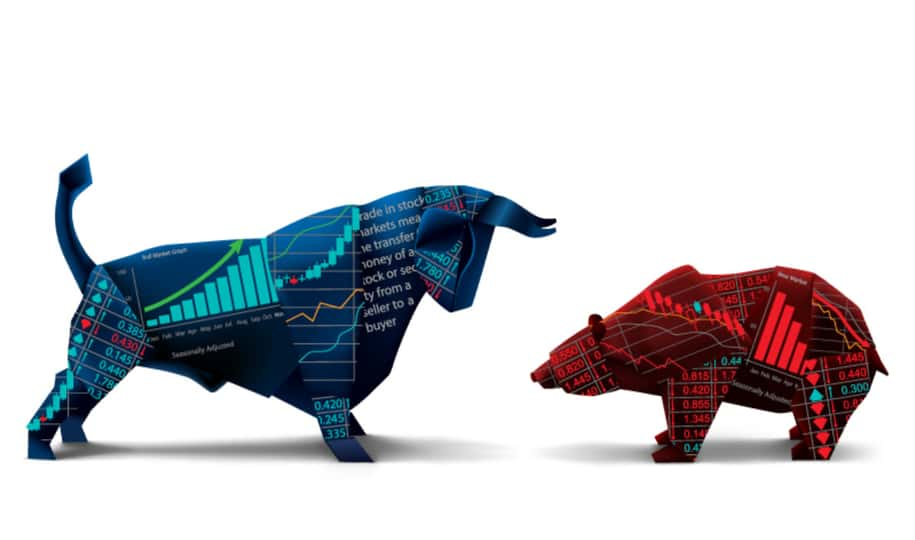
Quite some time ago this bull market was already declared the longest in history. Yet as we make new highs it is inching ever closer to the most profitable with a 383% gain since March 2009.
I thought it would be good to analyze the unique properties that led to this historic bull rally. In total I see 3 distinguishing marks that helped bolster the results. Then let’s follow that up with a health check on this bull to see how much longer it has to run given 3 obstacles standing in its way in 2020.
#1 = The Great Recession Lows
We all know that the financial crisis of 2008 created a generational bear market like we haven’t seen in eighty years. From peak to valley the S&P 500 fell 57%. When you consider that the average bear market produces only a 34% decline in stock prices, then you can easily appreciate how the extreme drop of the Great Recession bear provided fertile soil for the next bull rally.
#2 = The Fed Crushed Interest Rates
Former Fed Chairman, Ben Bernanke, was a student of the Great Depression and wanted to use a new set of tools to help get the economy back on track. These historic measures are best known as Quantitative Easing for which we had 3 rounds that took bond rates down to unprecedented lows.
This had 2 main benefits for the bull market. First, it made holding cash unattractive leading to more spending and investment. This helped get the economy back on track.
Second, stocks were considered the better value investment compared to the ultra low rates found in bonds. This kept a steady flow of buying activity pushing stocks higher. We will talk more about this relationship when we consider where stocks heads next.
#3 = Slow and Steady Wins the Race
A lot of economists condemned the post-recession recovery for being too slow. However, this may actually turn out to be a blessing in disguise.
You see, many of the best economic expansions have led to periods of overheated inflation. As it turns out that inflationary pressure often turned out to be the catalyst for the next recession and bear market.
This 10+ year expansion has averaged a more modest 2% GDP growth rate. With that is a very tame inflation outlook allowing the good times to continue longer.
Where Does the Market Head from Here?
The above factors continue to support this stock market even to this day. Especially the second point about low bond rates. Heck, even now the dividend yield on the S&P 500 is above the paltry 1.52% rate of the 10 year Treasury. This still makes stocks the much better value proposition versus bonds.
Unfortunately it is not all rainbows and lollipops this year. We have 3 unique factors that call the future upside for stocks into question:
- Corona Virus is Picking Up Speed: Likely its short term square that quickly blows over. However, the speed at which health organizations around the world are reacting it does raise question marks for the world economy which obviously is a negative for stock prices.
- Earnings Recession: We are in the midst of the 5th straight quarter of negative earnings growth. In general, earnings is the main catalyst behind share price gains. And the lack of growth is usually not a good sign.
- Presidential Election: Historical patterns show that the market gets very jittery coming into elections with significant drops coming into to November.
At this stage we have a mixed bag for stocks. That’s why on Tuesday February 4th @ 4:15pm I am having a free webinar to provided an updated stock market outlook for 2020.
At this webinar I will cover all the topics noted above plus:
- Year End S&P Forecast
- Formula to find stocks ready to outperform in 2020
- 2 new “must own” stocks revealed
- And more to get you ready to enjoy more investment success in the year ahead!
Please join me, and investing legend Adam Mesh, for this live webinar to get you better aligned for what the market offers investors this year.
Just click the link below to register for this vital event.

Steve Reitmeister
…but everyone calls me Reity (pronounced “Righty”)
CEO, Stock News Network
Editor, Reitmeister Total Return
SPY shares closed at $321.73 on Friday, down $-5.95 (-1.82%). Year-to-date, SPY has declined -0.04%, versus a -0.04% rise in the benchmark S&P 500 index during the same period.
About the Author: Steve Reitmeister

Steve is better known to the StockNews audience as “Reity”. Not only is he the CEO of the firm, but he also shares his 40 years of investment experience in the Reitmeister Total Return portfolio. Learn more about Reity’s background, along with links to his most recent articles and stock picks. More...
More Resources for the Stocks in this Article
| Ticker | POWR Rating | Industry Rank | Rank in Industry |
| SPY | Get Rating | Get Rating | Get Rating |
| Get Rating | Get Rating | Get Rating | |
| IWM | Get Rating | Get Rating | Get Rating |
| MDY | Get Rating | Get Rating | Get Rating |
| QQQ | Get Rating | Get Rating | Get Rating |


