
The stock market is experiencing the 2nd largest bubble in US market history, and I would argue it’s the craziest one in history.
(Source: Ycharts)
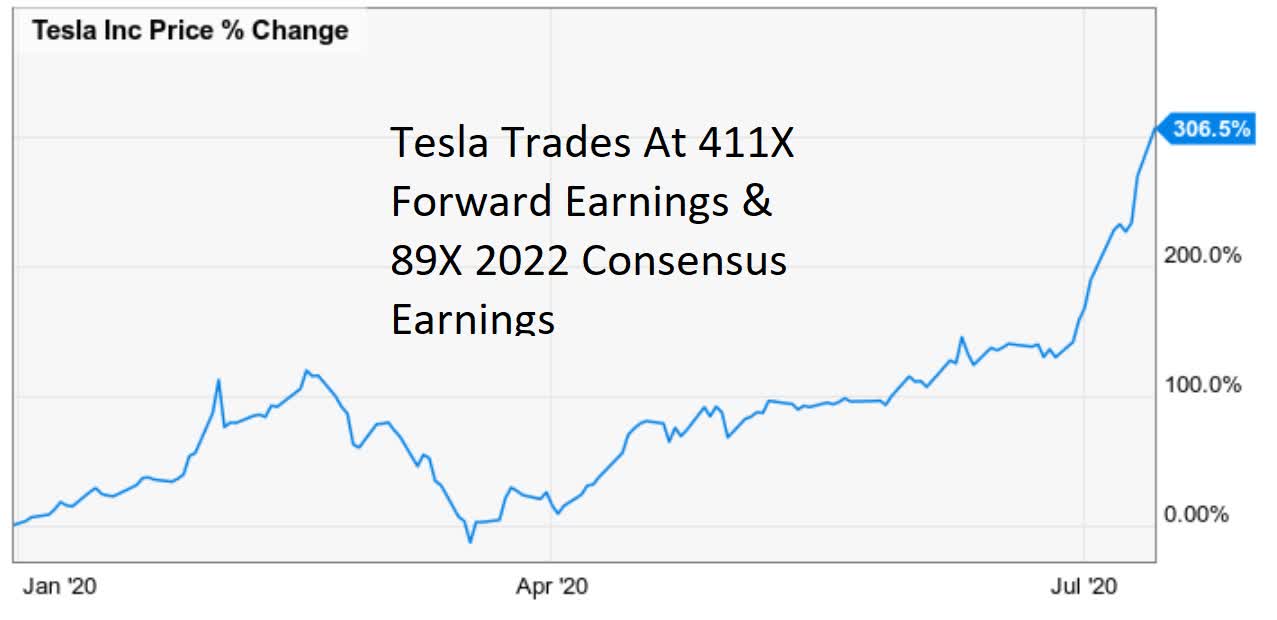
That’s not just because individual stocks like Tesla (TSLA) have gone vertical, trading at
- 411 times forward earnings
- 89 times 2022 consensus earnings
- $316 billion market cap (more than all but 14 companies in America)
Rather, it’s because the S&P 500, is trading at the highest valuations in 19 years.
S&P 500 Valuation Profile
| Year | EPS Consensus | YOY Growth | Forward PE | Blended PE | Overvaluation (Forward PE) | Overvaluation (Blended PE) |
| 2020 | $124.80 | -23% | 25.5 | 22.3 | 56% | 31% |
| 2021 | $163.32 | 30% | 19.5 | 22.5 | 19% | 32% |
| 2022 | $187.06 | 13% | 17.0 | 18.3 | 4% | 7% |
| 12-month forward EPS | 12 Month Forward PE | Historical Overvaluation | PEG | 20-Year Average PEG |
| $142.98 | 22.3 | 36% | 2.62 | 2.35 |
(Sources: Brian Gilmartin, Reuters’/Refinitiv/IBES/Lipper Financial, F.A.S.T Graphs, FactSet Research)
What does this overvaluation mean for future market returns?
S&P 500 Total Return Profile
| Year | Upside Potential By End of That Year | Consensus CAGR Return Potential By End of That Year | Probability-Weighted Return (CAGR) |
| 2020 | -32.2% | -55.8% | -42.2% |
| 2021 | -10.5% | -7.3% | -5.5% |
| 2022 | 4.8% | 1.9% | 1.4% |
| 2025 | 32.3% | 5.2% | 3.9% |
(Source: F.A.S.T Graphs, FactSet Research)
That future returns are likely to be about 50% less than the market’s historical 7% to 9% CAGR.
The market is literally praying like it’s 1999, yet we are facing an economy like 1929.
(Source: MarketWatch)
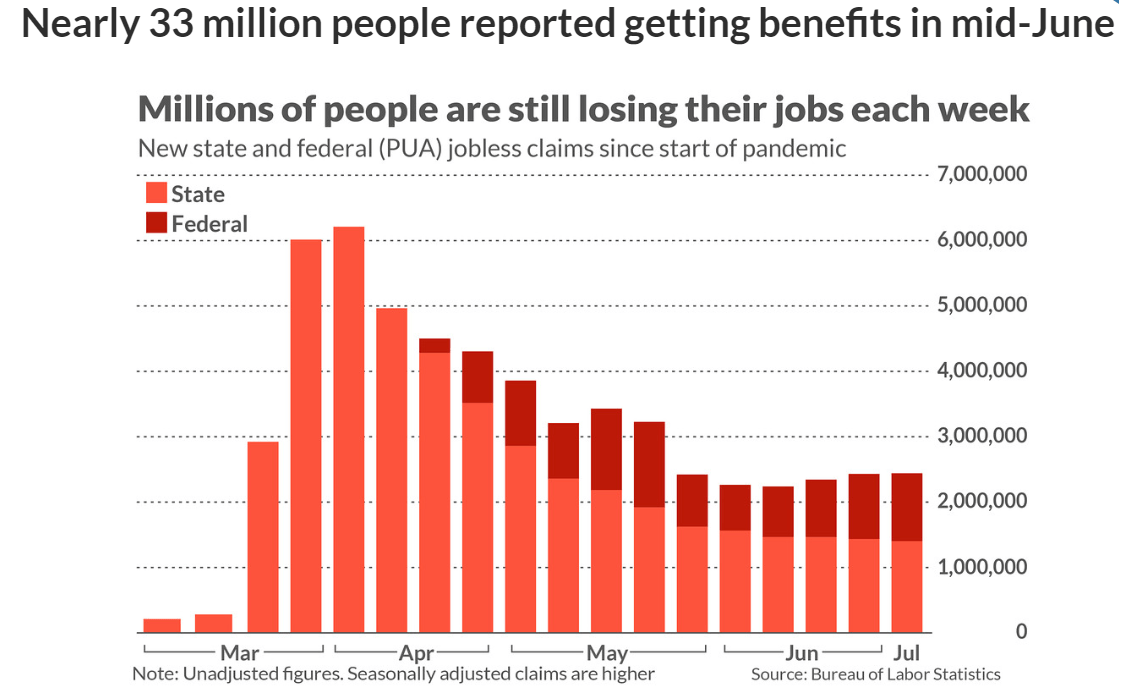
Every week 2.4 million new people are filing for unemployment if you include Federal filings. For two weeks total unemployment claims are rising, not falling.
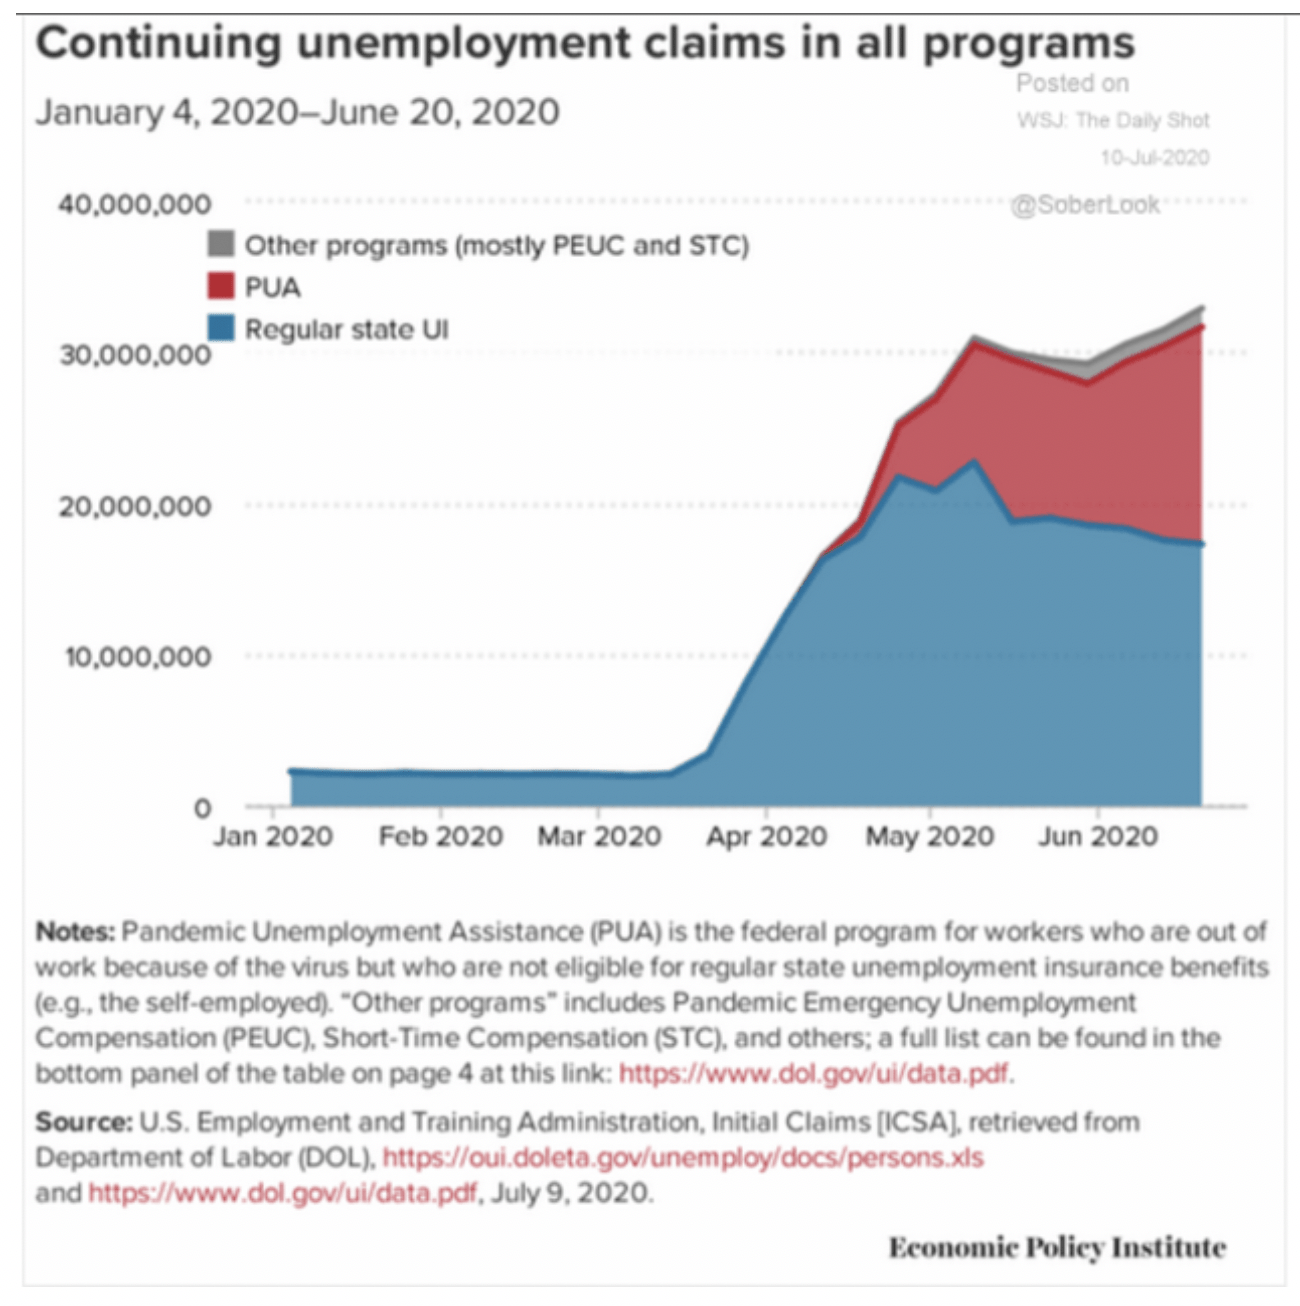
Total unemployment has not been falling, it’s been rising for weeks, and now stands at 32.9 million, the highest absolute number ever recorded.
Actual unemployment today is worse than it was in April.
What’s more, 20% of the pre-pandemic workforce is now out of work and
- according to the Economic Policy Institute, 11% of lost jobs are gone forever
- another 10.3 million job losses could be coming through the end of 2021 merely from insufficient fiscal stimulus
- 22% of small business said in the latest National Federation of Independent Business Federation of Independent Businesses that they will soon start laying off workers
- companies large and small have begun laying off workers purely for economic reasons, having no direct connection to the pandemic
In a worrisome sign, more than two months after states like Georgia lifted their shelter-in-place orders, layoffs are spreading beyond companies that provide services requiring direct human contact. As disruption from the pandemic lingers, this could mean that the job loss is starting to feed on itself in a classic recessionary spiral, economists said.” – Washington Post.
In other words, we are facing the prospect of a Moody’s depression, meaning 12 consecutive months of 10+% unemployment.
If COVID-19 cases continue to surge, the consumers are likely to pull back on spending and they have already started doing in recent weeks.
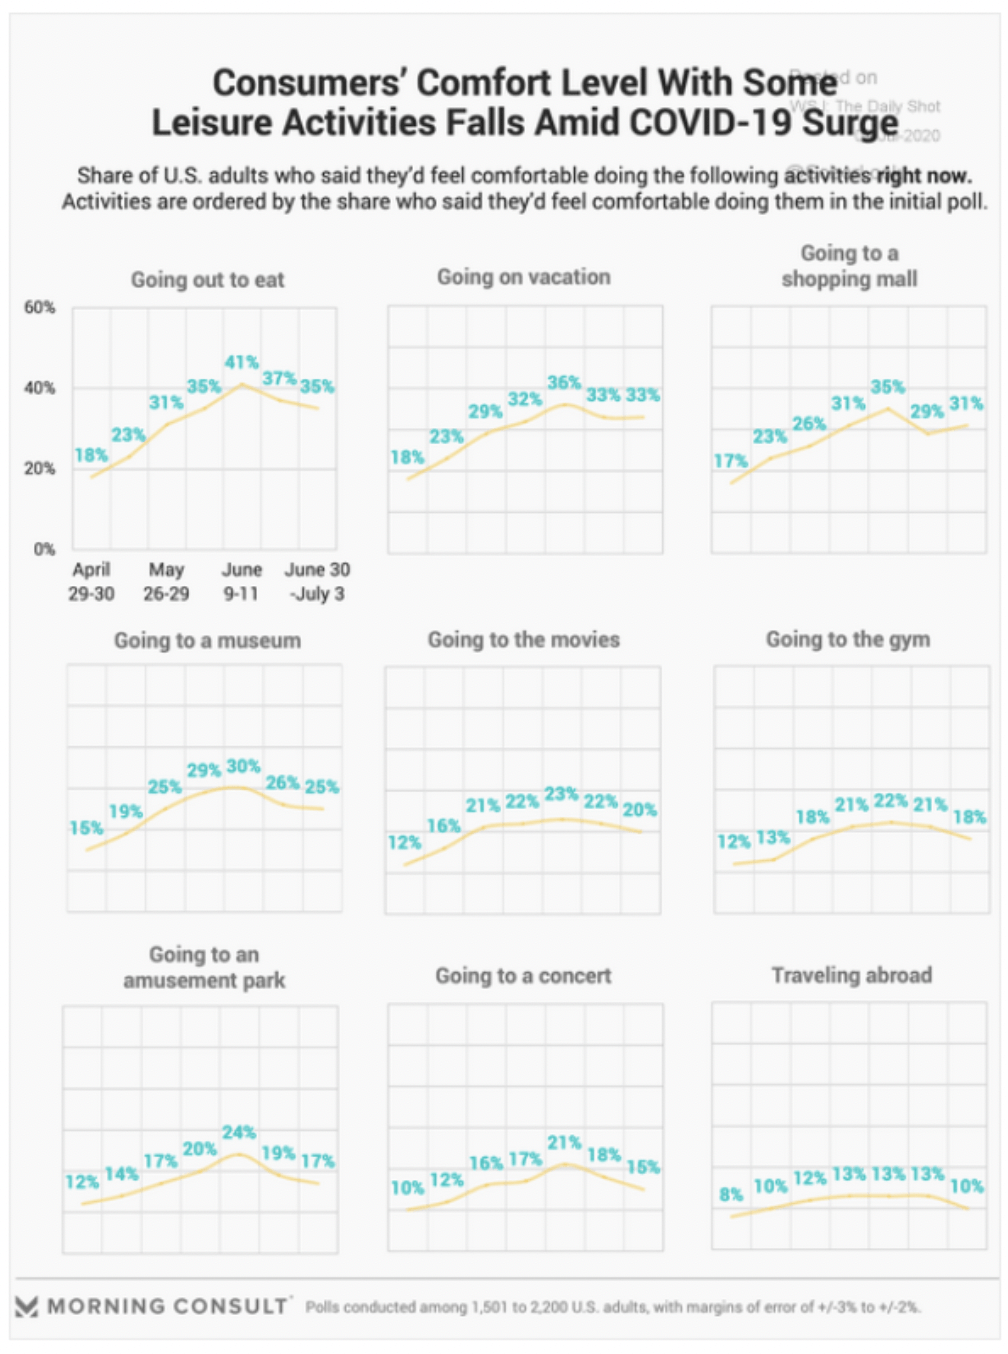
The US recovery, which started out strong, appears to have run out of steam.
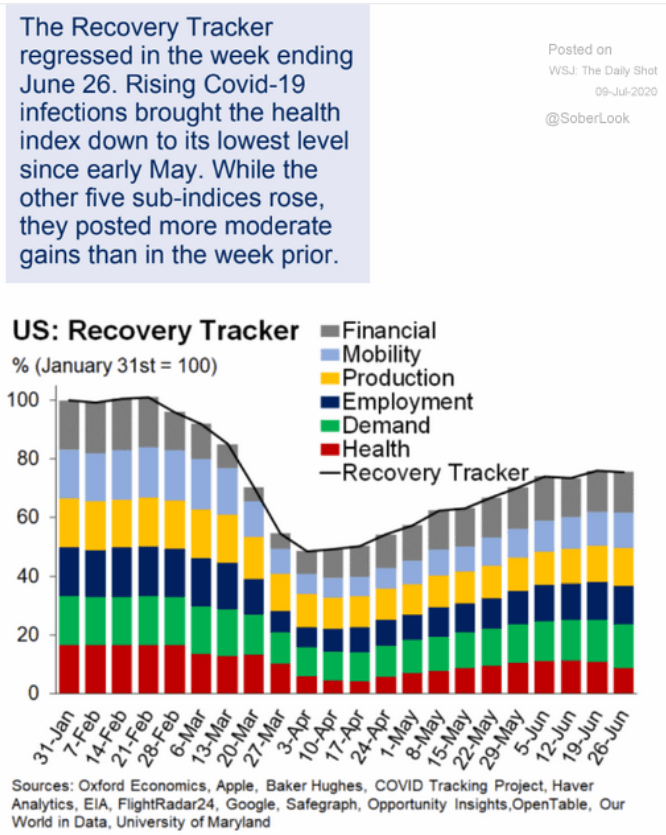
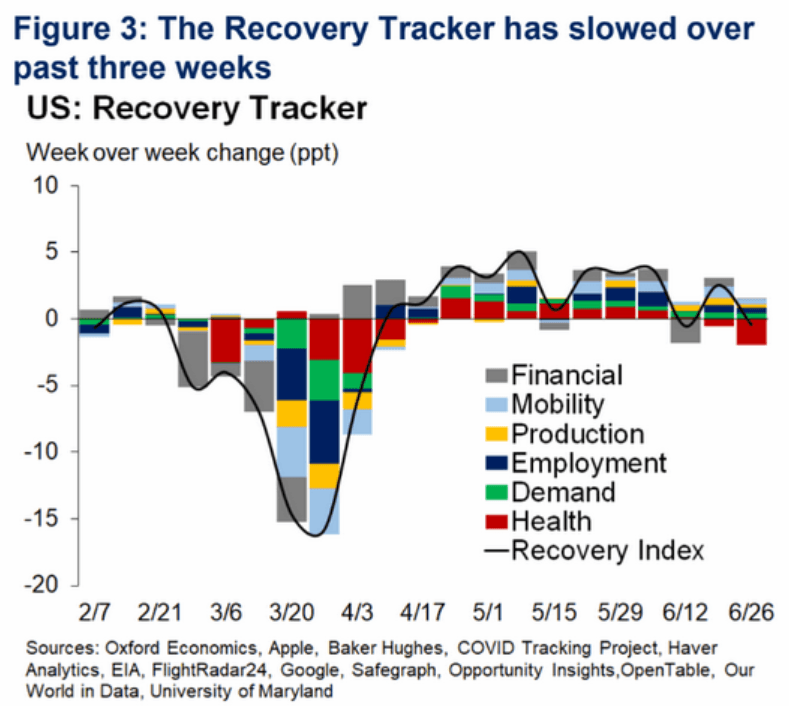
And that data was mostly before the major surge in cases really got underway.
It’s also before the official second wave that’s expected to start in September when schools reopen.
As Moody’s chief economist Mark Zandi noted months ago, a second wave of the virus, even if it doesn’t lead to more lockdowns, could lead to sustained double-digit unemployment, meeting Moody’s definition of a depression.
If we get a second wave, it will be a depression,” the firm’s chief economist told CNBC’s “Trading Nation” on Friday. “We may not shut down again, but certainly it will scare people and spook people and weigh on the economy.” – CNBC
We’re not likely facing a decade long Great Depression, but it does mean the 2nd most overvalued stock market in history is the most disconnected from economic fundamentals in history.
None of this means that the economy is destined to repeat its sickening March plunge. But many economists expect what Rubeela Farooqi of High-Frequency Economics calls a “stop-and-go recovery” that will advance or retreat depending upon public health…
“I don’t think any of us think we’ll get the economy back to 100 percent before there’s a medical answer,” said James Glassman, JPMorgan Chase’s head economist for commercial banking. “The longer it goes on, the more damage it does.” – Washington Post
Medical experts and economists now agree, there is very little chance the economy can fully recover until the pandemic ends. That’s not likely until 2022.
We’re likely in the bottom of the 2nd inning of the ball game, yet stocks are acting as if we’ve already won the world series.
But just because the worst economic fundamentals since the 1930s means that stocks SHOULD fall soon, doesn’t mean they will.
Why The Craziest Bubble In History Might Get Even Bigger
The nature of bubbles is the “great fool theory”. Why does it make sense to buy Tesla at 400 times earnings? Because you have a plausible reason to think some greater fool will pay you 500X earnings later. And that fool will do so because he thinks a true idiot will pay 600X earnings for his shares.
In the case of TSLA, the speculative mania is built on the insanely speculative chain of reasoning that goes like this
- Tesla is announcing earnings on July 22nd
- IF they report GAAP profit then S&P 500 MIGHT add them to the index
- S&P 500 is market-cap-weighted, so the large TSLA’s market cap gets the more index funds would have to buy, regardless of valuation
- thousands of index funds might have to pour billions into the stock, valuations be darned
- Thus, institutional index funds would be the “greater fools” that COULD generate large short-term profits for speculators looking to score a quick buck
What about the much larger S&P 500 whose market cap is over $32 trillion? Who could possibly be a big enough fool to keep inflating a bubble that is objectively irrational given the realities of viral economics?
Here’s JPMorgan’s Marko Kolanovic, head of macro quantitative and derivatives research for JPMorgan, explaining
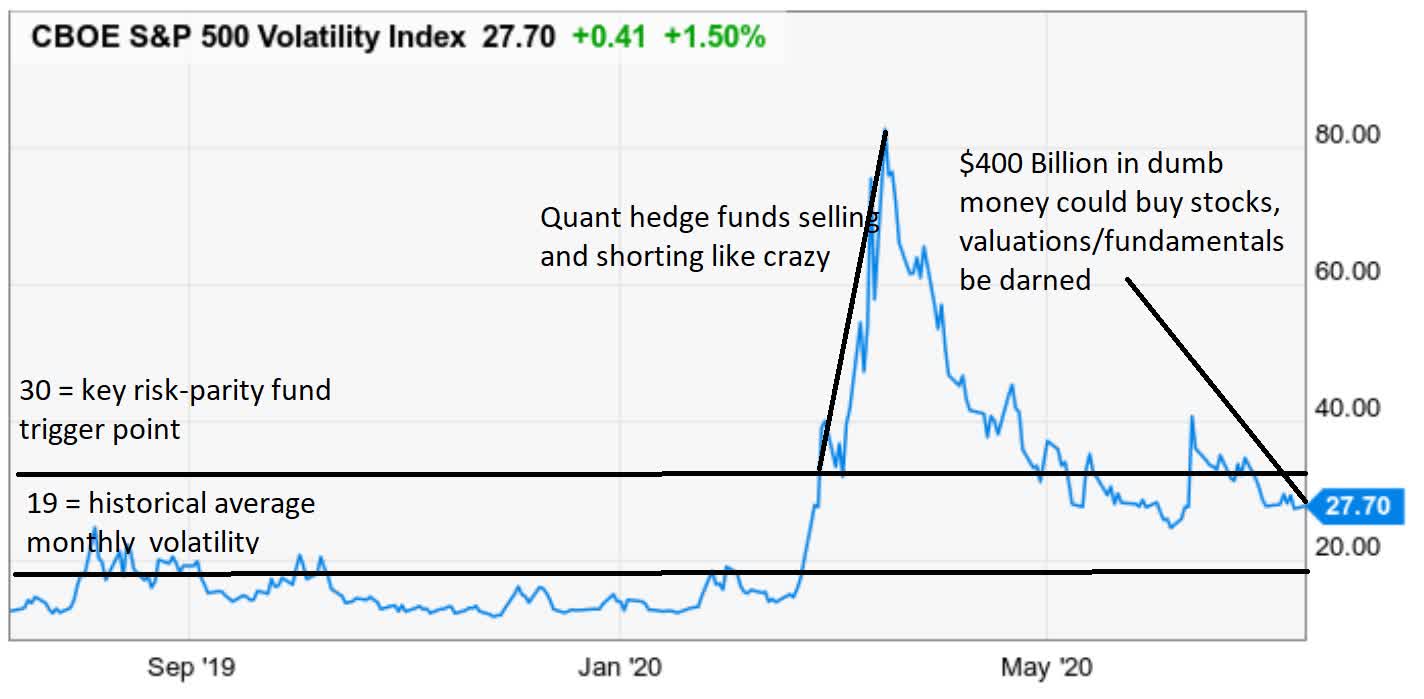
Quantitative hedge funds — including volatility targeting and risk parity funds — slashed exposure to the stock market earlier in 2020 as virus risks raged. The trading algorithms commonly used by such firms target specific gauges to decide when capital should be pulled from or added to stocks.
If the volatility-tracking VIX index falls below 30 though the summer, the firms’ programs are set to push hundreds of billions of dollars back into the stock market, Kolanovic said.
“For these investors to reach their historical median equity exposure, they would need to add ~$400 billions of equity exposure, which can easily push the broad market to new highs. he wrote.” – Business Insider (emphasis added)
The answer is quant-based hedge funds who JPMorgan estimates might be in the process of pouring $400 billion into stocks, mostly the S&P 500.
Why Stocks Might Get Into An Even Bigger Bubble In The Coming Weeks
(Source: Ycharts)
Since stocks tend to rise slower than they drop, a rising market tends to mean falling volatility.
- the more stocks go up the lower the VIX goes
- the lower the VIX goes the more money quant funds that only look at the VIX must put into stocks, regardless of anything else going on in the world
- the more money that pours into stocks the lower the VIX is likely to fall
- and so, it goes in a vicious cycle of speculative mania
Or to put another way, the higher stocks go, the more money goes into stocks, driving the craziest bubble in history (the only one I know of to occur in what could be defined as a possible depression) to even crazier levels.
(Source: imgflip)
Is JPMorgan correct? Is a massive pool of dumb money driving the market? It’s a plausible theory though we’ll never know for sure.
MSFT is 70% Over Value…Only Gamblers (And Possibly Quant Funds) Are Buying It Now
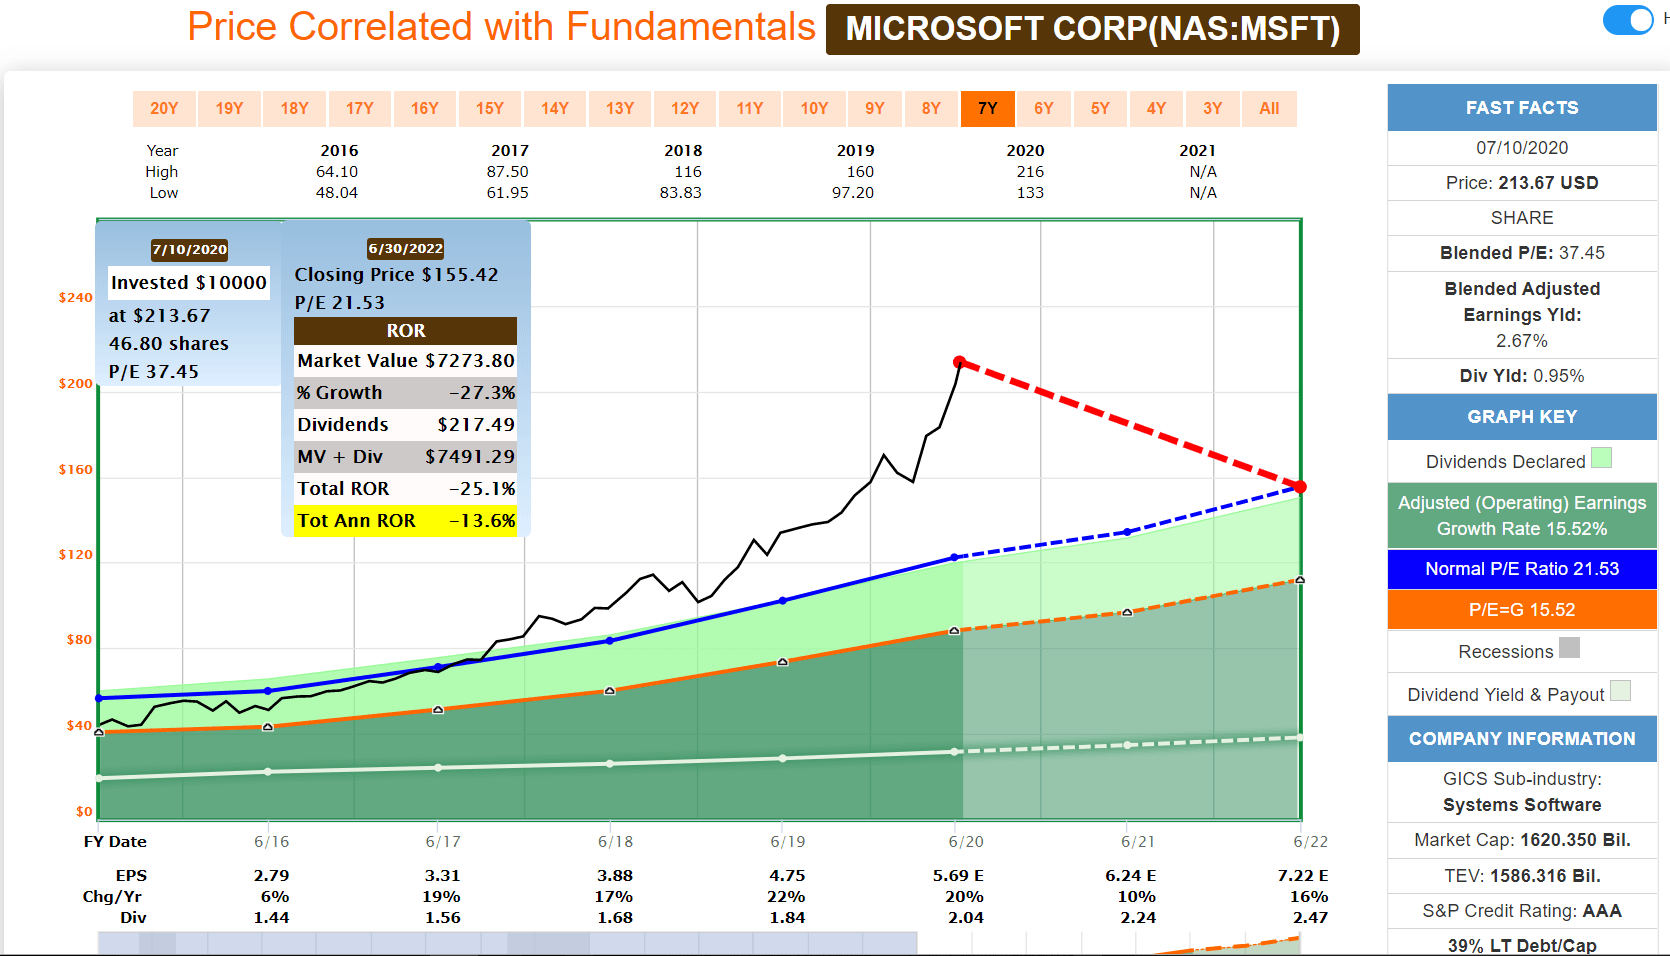
(Source: F.A.S.T Graphs, FactSet Research)
What that means for popular stocks like Microsoft (MSFT), is that it’s already objectively irrational valuation is potentially set to go higher, though to what extent is pure guesswork.
Note that MSFT is expected to grow 15% CAGR over the long-term, according to Reuters. Over the last 7 years, MSFT’s 15% CAGR EPS growth has been rewarded by an average PE of 21.5.
That means that if MSFT grows as expected, it’s likely to return to the market-determined fair value PE of 21.5. If that happens by the end of 2022, then investors buying today could expect to lose 25%.
That’s already a premium to the 15 PE that Graham/Dodd and Chuck Carnevale consider “reasonable and prudent” for companies growing at that rate.
Yet MSFT, as one of the largest names in the S&P 500, could see a large amount of quant money fund flows drive it to truly tech bubble levels, such as the 50 times earnings it saw in early 2000.
In Part 2 of this series, I’ll show you how to protect yourself from the manic market madness gripping Wall Street, both to earn sound long-term profits, but most of all, avoid costly losses, when the bubble inevitably pops.
Want More Great Investing Ideas?
9 “BUY THE DIP” Growth Stocks for 2020
Top 5 WINNING Stock Chart Patterns
7 “Safe-Haven” Dividend Stocks for Turbulent Times
SPY shares were trading at $322.98 per share on Wednesday morning, up $4.06 (+1.27%). Year-to-date, SPY has gained 1.38%, versus a % rise in the benchmark S&P 500 index during the same period.
About the Author: Adam Galas

Adam has spent years as a writer for The Motley Fool, Simply Safe Dividends, Seeking Alpha, and Dividend Sensei. His goal is to help people learn how to harness the power of dividend growth investing. Learn more about Adam’s background, along with links to his most recent articles. More...
More Resources for the Stocks in this Article
| Ticker | POWR Rating | Industry Rank | Rank in Industry |
| SPY | Get Rating | Get Rating | Get Rating |
| MSFT | Get Rating | Get Rating | Get Rating |


