
It’s been a wild year for investors. The market began with a continued rally following 2019’s 31% gains, saw the fastest bear market in history, with March’s 34% plunge, and then a V-shaped stock market recovery.
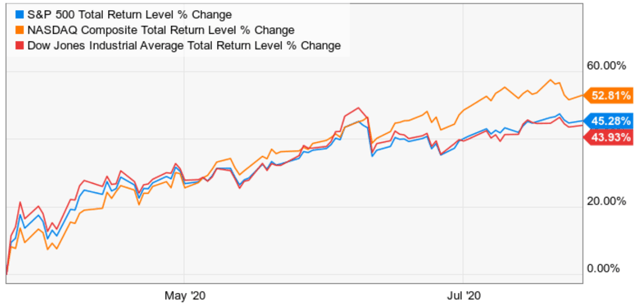
(Source: Ycharts)
The S&P 500, Dow Jones Industrial Average, and Tech-focused Nasdaq, have seen remarkable gains since March’s lows. But one thing, in particular, has driven that rally, hopes for a V-shaped economic recovery.
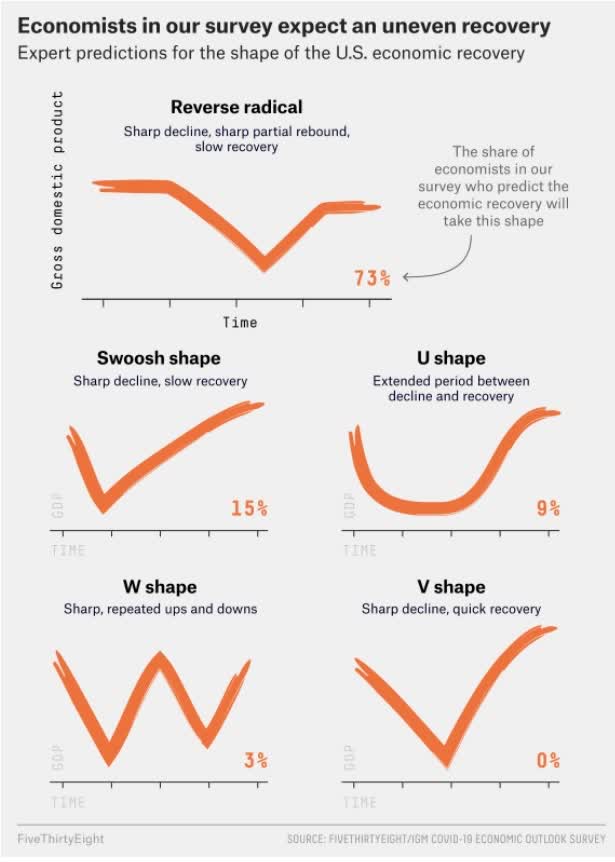
A recovery that no economists in months have actually expected to happen. In this two-part series, I’ll explain why the next two weeks are likely to prove critical to how the US economy will fare in the coming years, which has important implications for stocks that are currently in the craziest bubble in history.
Hopes Of A V-Shaped Recovery Are Dead
Just because economists didn’t expect a V-shaped recovery doesn’t mean one might not have happened. After all, the US economy in recent years has tended to beat to the upside. However, recent high-frequency data has pretty much driven a stake through the heart of even the most optimistic economic forecasts.
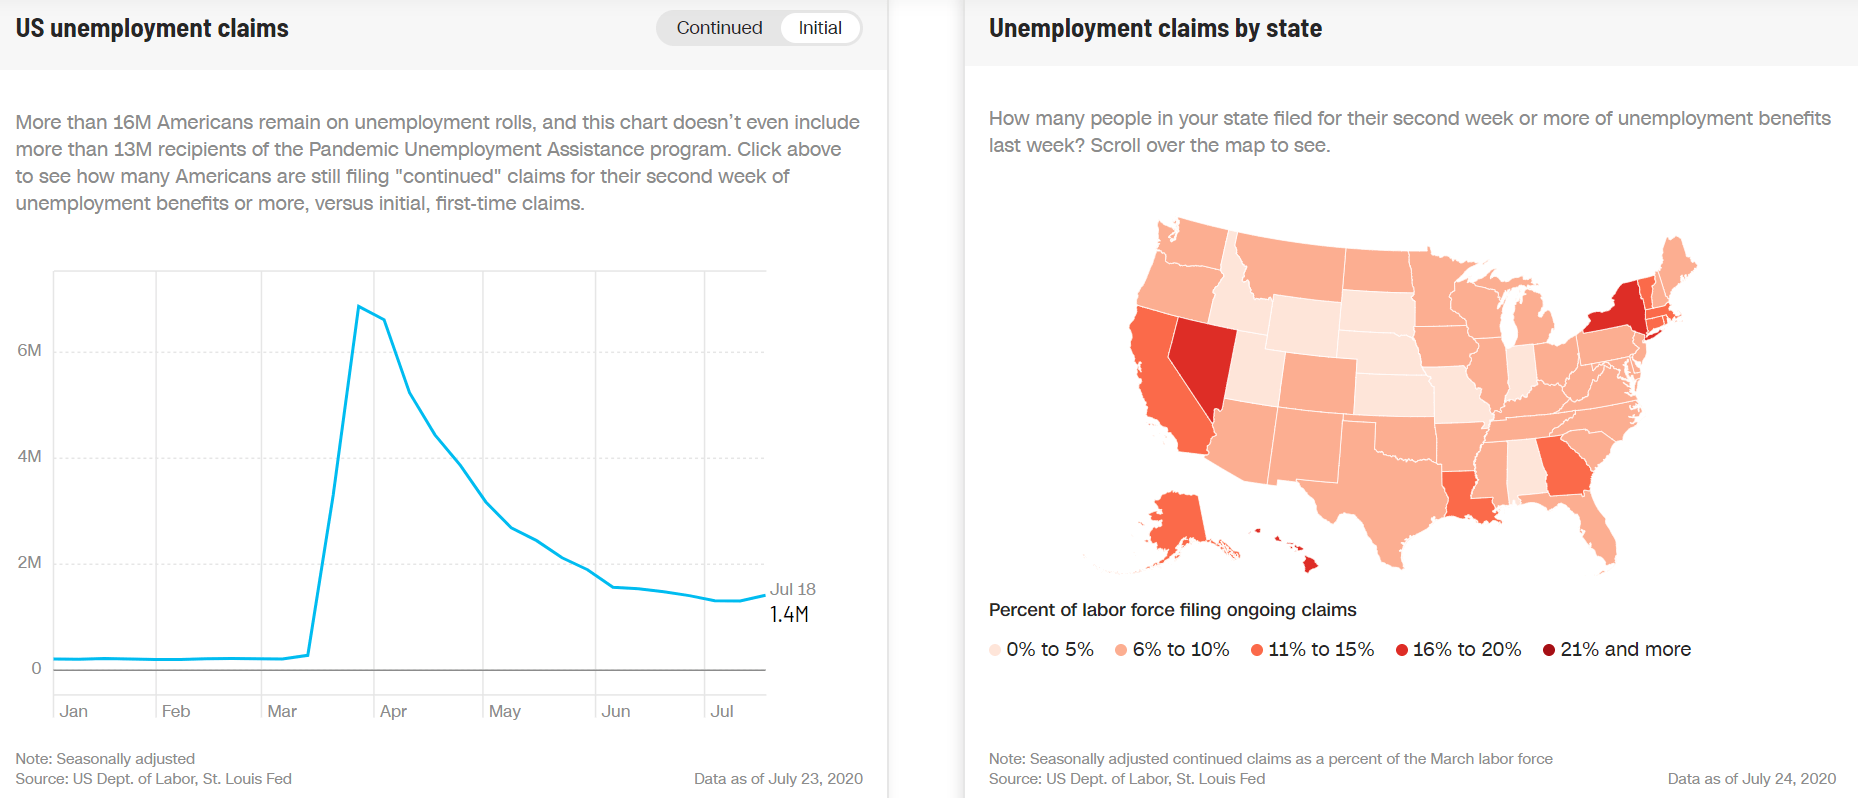
(Source: CNN economy tracker)
After falling for 15 straight weeks, new weekly state unemployment claims ticked higher last week. And those are just the headline numbers Wall Street pays attention to. The actual facts reveal a labor market that continues to be, what one economist called in April “a house of horrors.”
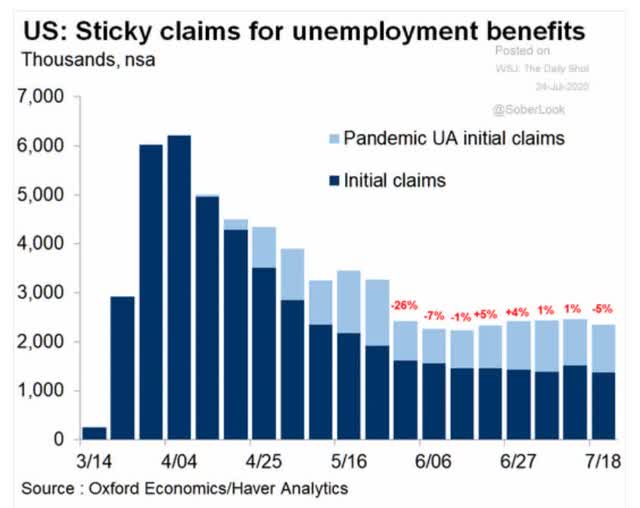
When you factor in contractors and gig workers, who have to file for unemployment with the Federal government, new unemployment claims have been stable at about 2.4 million per week for the last two months.
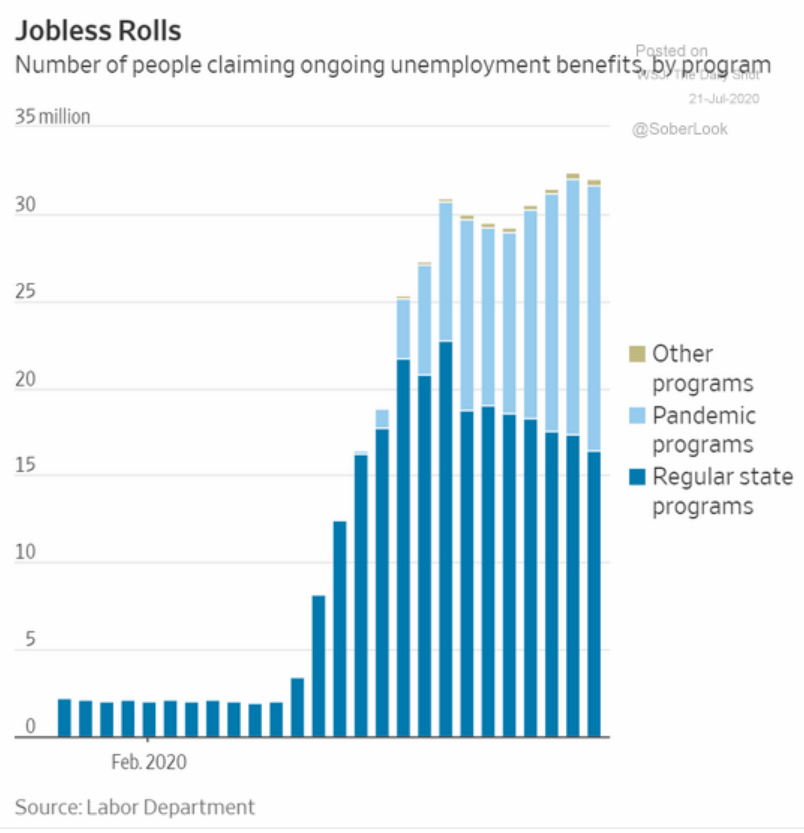
(Source: Jeff Miller)
We have 32 million Americans currently collecting unemployment and another 2 million or so have filed but not yet been processed. In other words, about 34 million Americans are currently unemployed, roughly six times as many people as there are job openings right now.
For context, the labor market was 164.8 million pre-pandemic meaning about 20% of the pre-recession workforce remains out of work.
34 Million Unemployed vs 5.4 Million Jobs
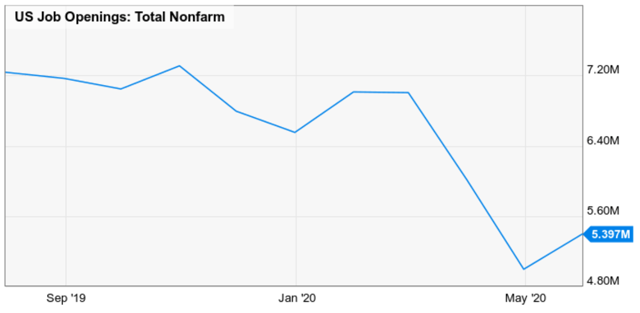
(Source: Ycharts)
How stressed are US families right now? The US Census Bureau performs weekly “Pulse” surveys of both small businesses and households to track the microeconomic impact of this recession.
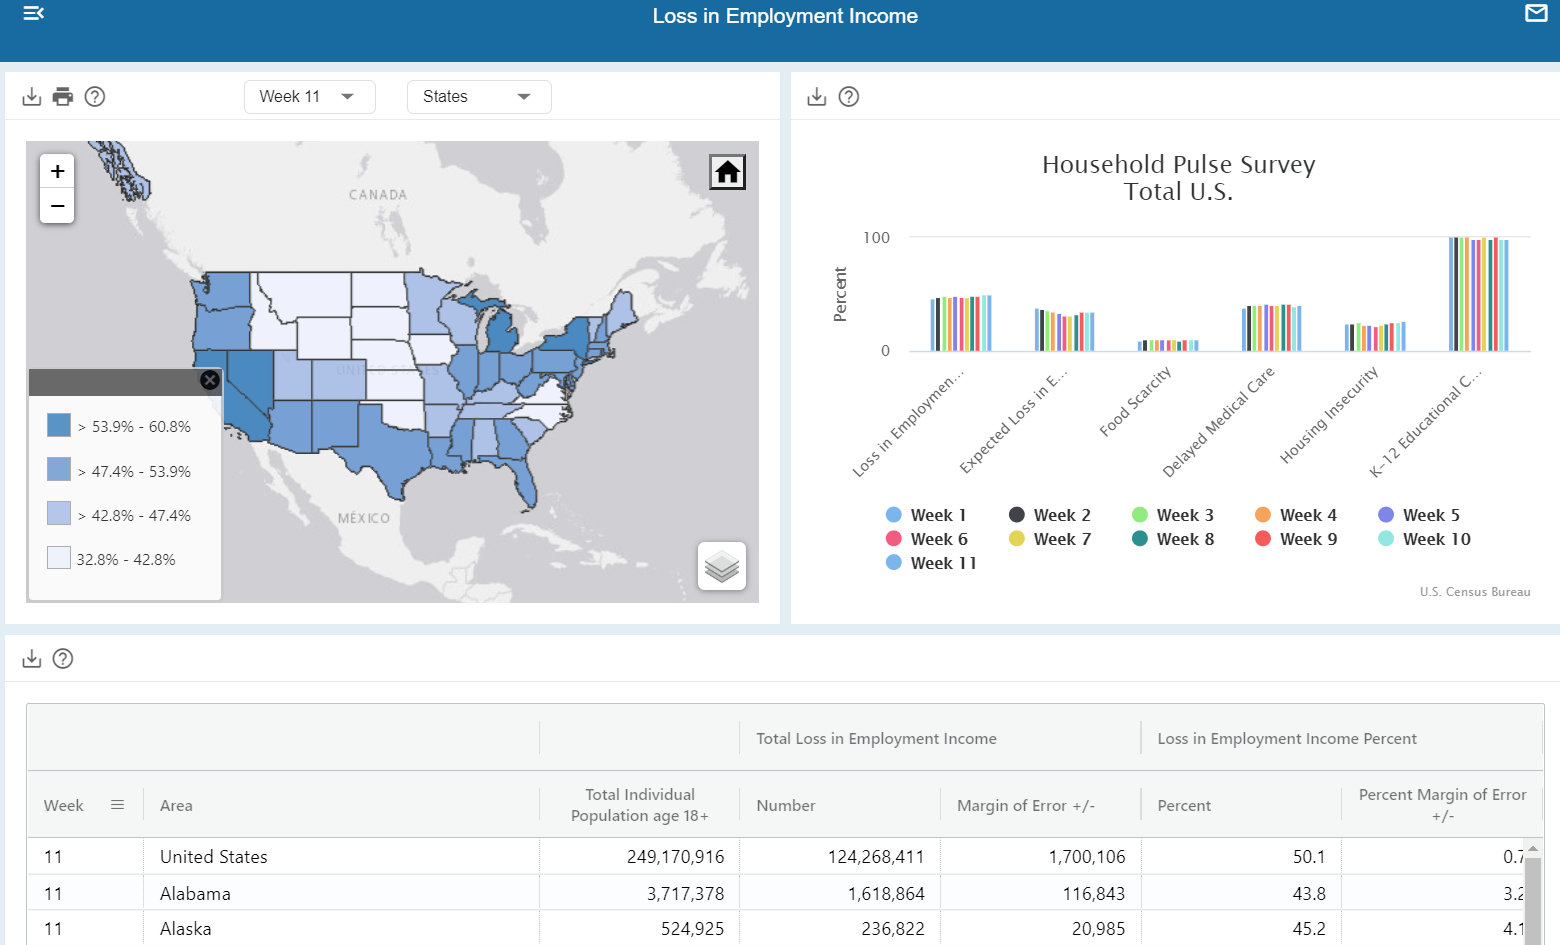
(Source: US Census Bureau Household Pulse Survey)
50.1% of households report a decline in employment income relative to pre-pandemic levels. That ranges from 32.3% in Nebraska to 64.8% in Los Angeles. That’s not so surprising given that states alone have reported 53 million job losses since this pandemic began. What is potentially worrying is that another 35.1% report expecting income to drop over the next month.

(Source: US Census Bureau Household Pulse Survey)
That ranges from just 15.7% in South Dakota to frightening 53.6% in Hawaii. What does this level of income insecurity mean for households and consumers?
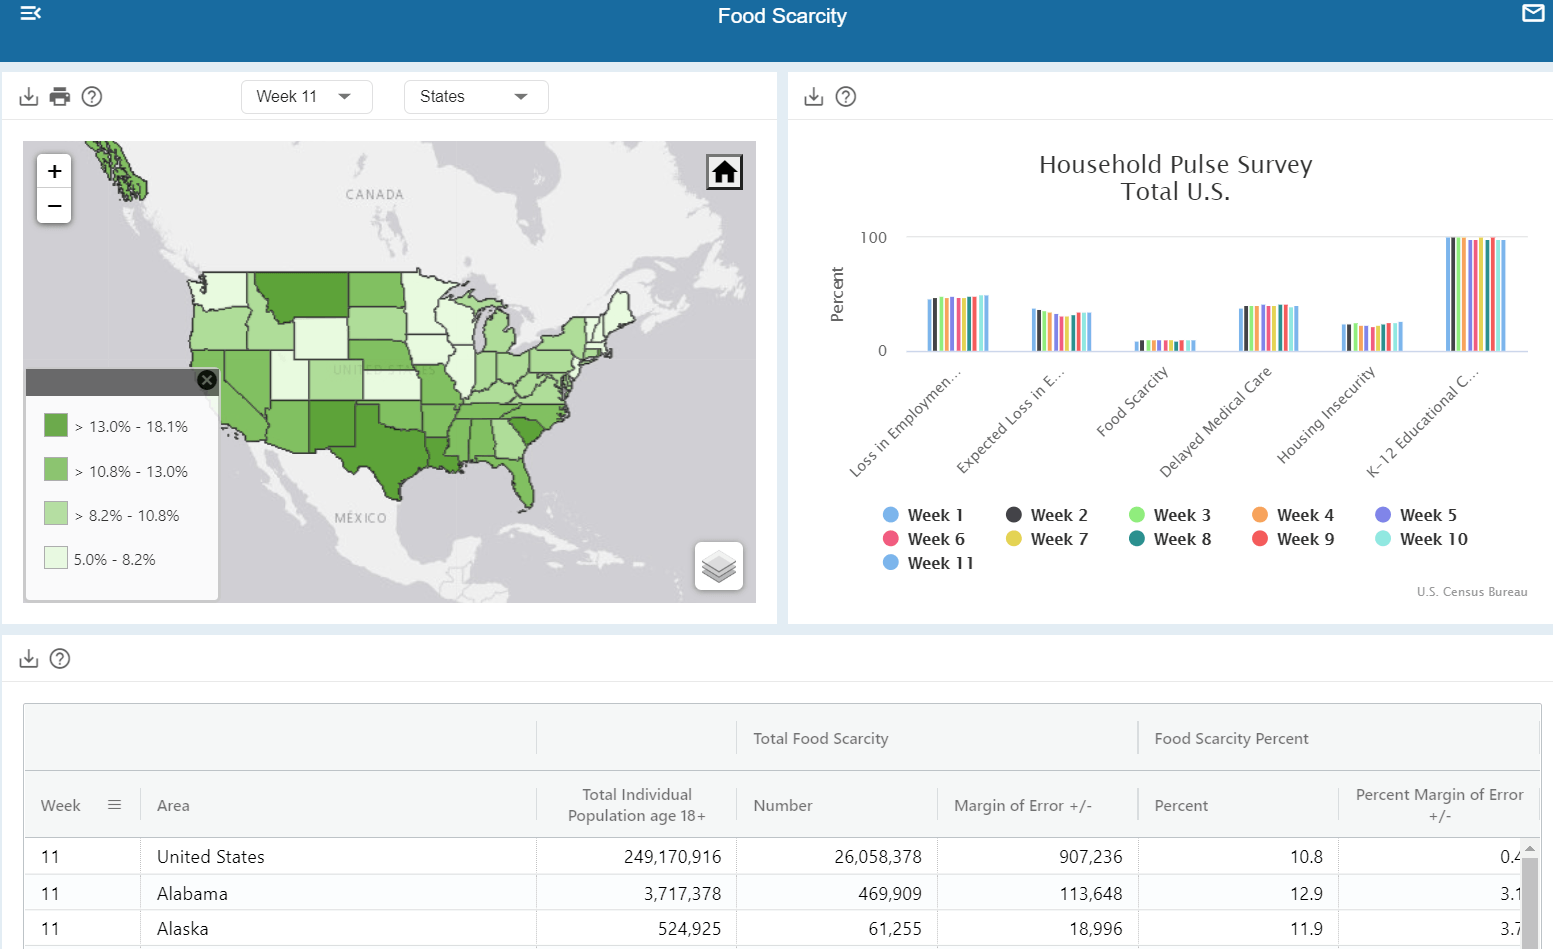
(Source: US Census Bureau Household Pulse Survey)
That 10.8% of households report not having enough to eat over the last week. That’s up from 9.8% 11 weeks ago and ranges from 2.7% in Vermont to a third world like 21.0% in Mississippi. It means that 40.6% of households report delaying medical care over the past month, up from 38.7% 11 weeks ago. That ranges from 24.5% in North Dakota to 53.4% in Philadelphia.
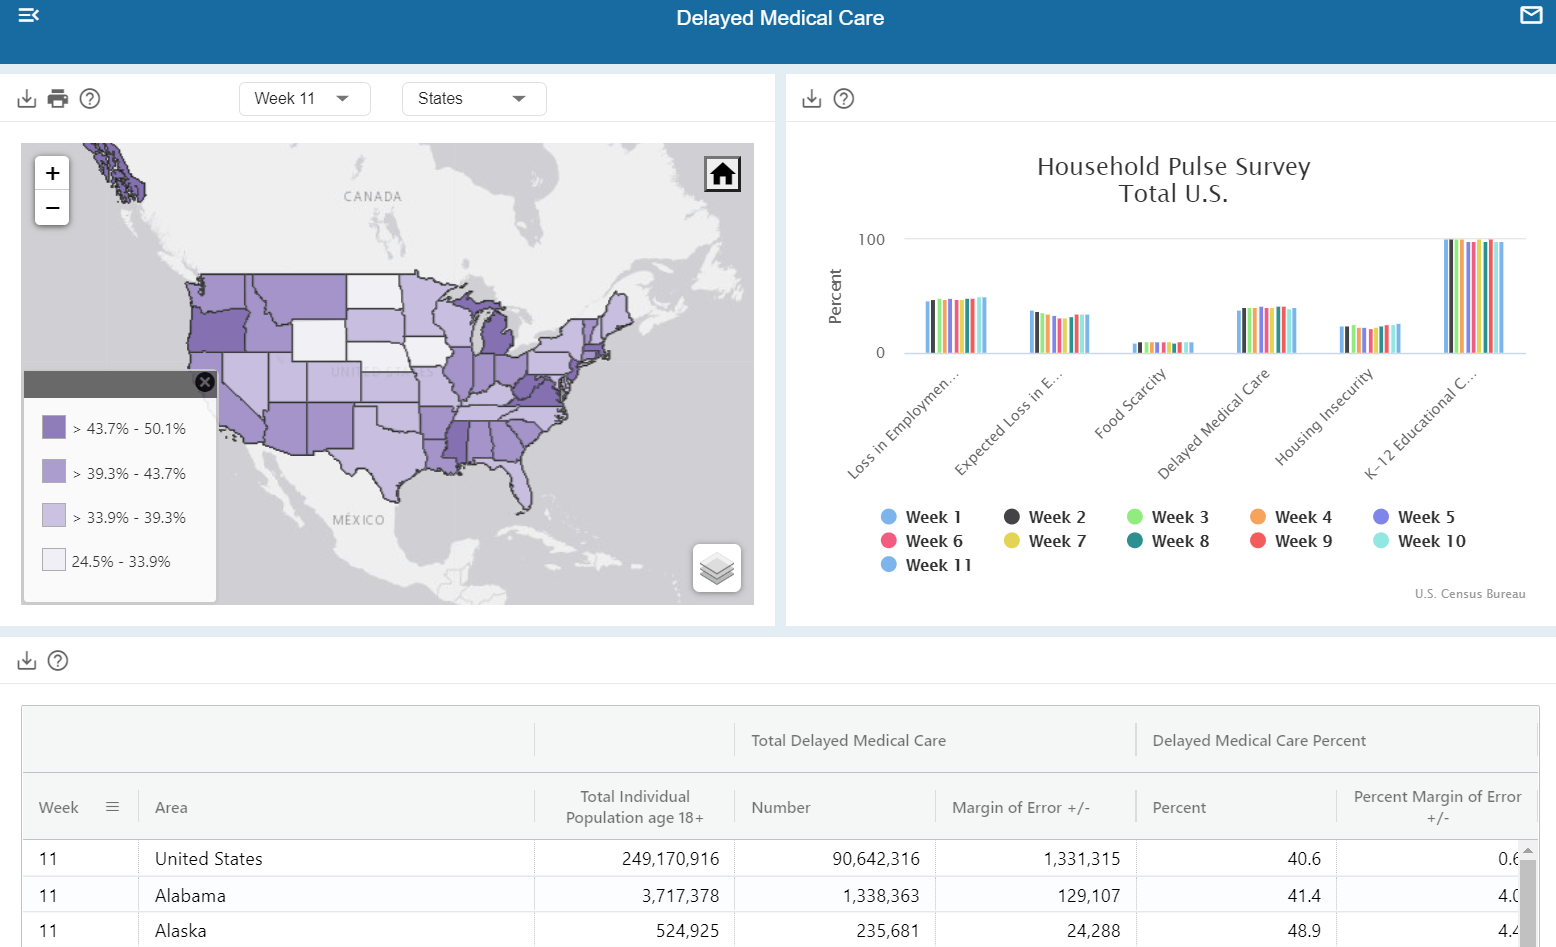
(Source: US Census Bureau Household Pulse Survey)
Perhaps most concerning is the fact that 26.4% of American households report housing insecurity, with a range of just 7% in Vermont, to 46.4% in Mississippi.

(Source: US Census Bureau Household Pulse Survey)
In other words, in Mississippi, about 21% of people report going hungry, and almost half are worried they could become homeless relatively soon. These worrying survey results have been generally trending steadily worse over the last 11 weeks, during which the stock market has been partying like pandemic is over. In reality, medical experts say it’s likely to continue into 2022.
In an economy where 65% to 70% of GDP is driven by consumer spending, you’d expect such terrible microeconomic data to lead to falling spending, and the high-frequency data is starting to confirm this.
The Economic News Goes From Bad To Worse
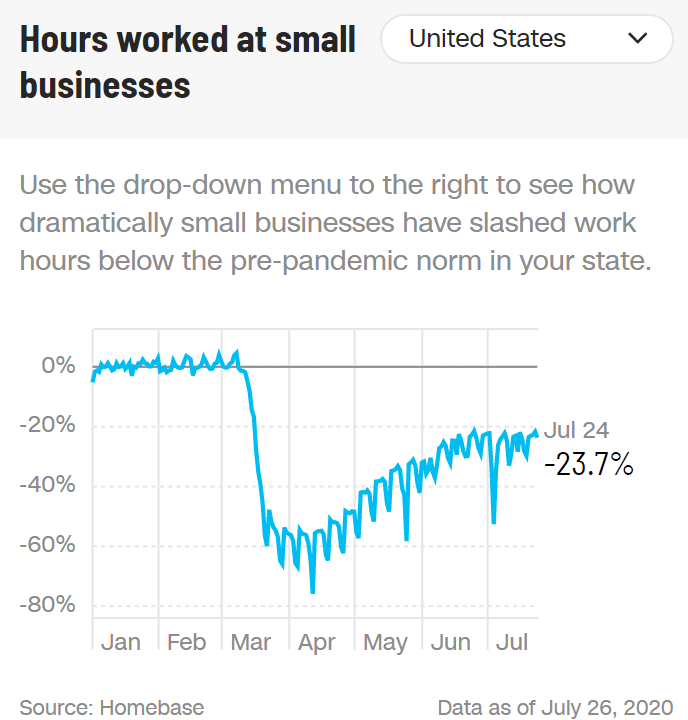
After states reopened in May and June, hours worked at small businesses went from -77% below the February baseline to -22%. And it’s now stalled at about -24%.
(Source: CNN economy tracker)
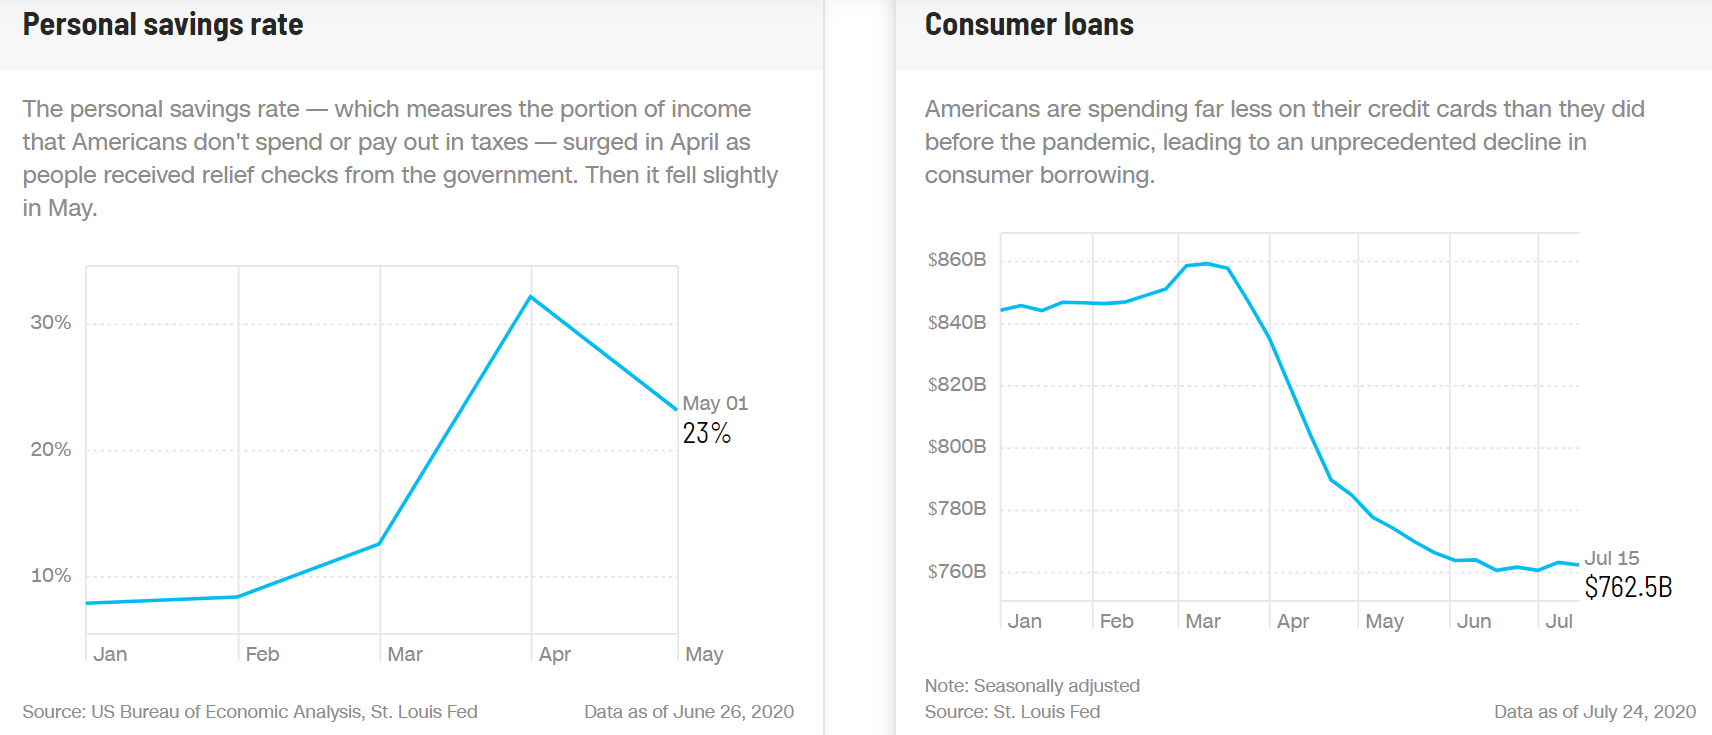
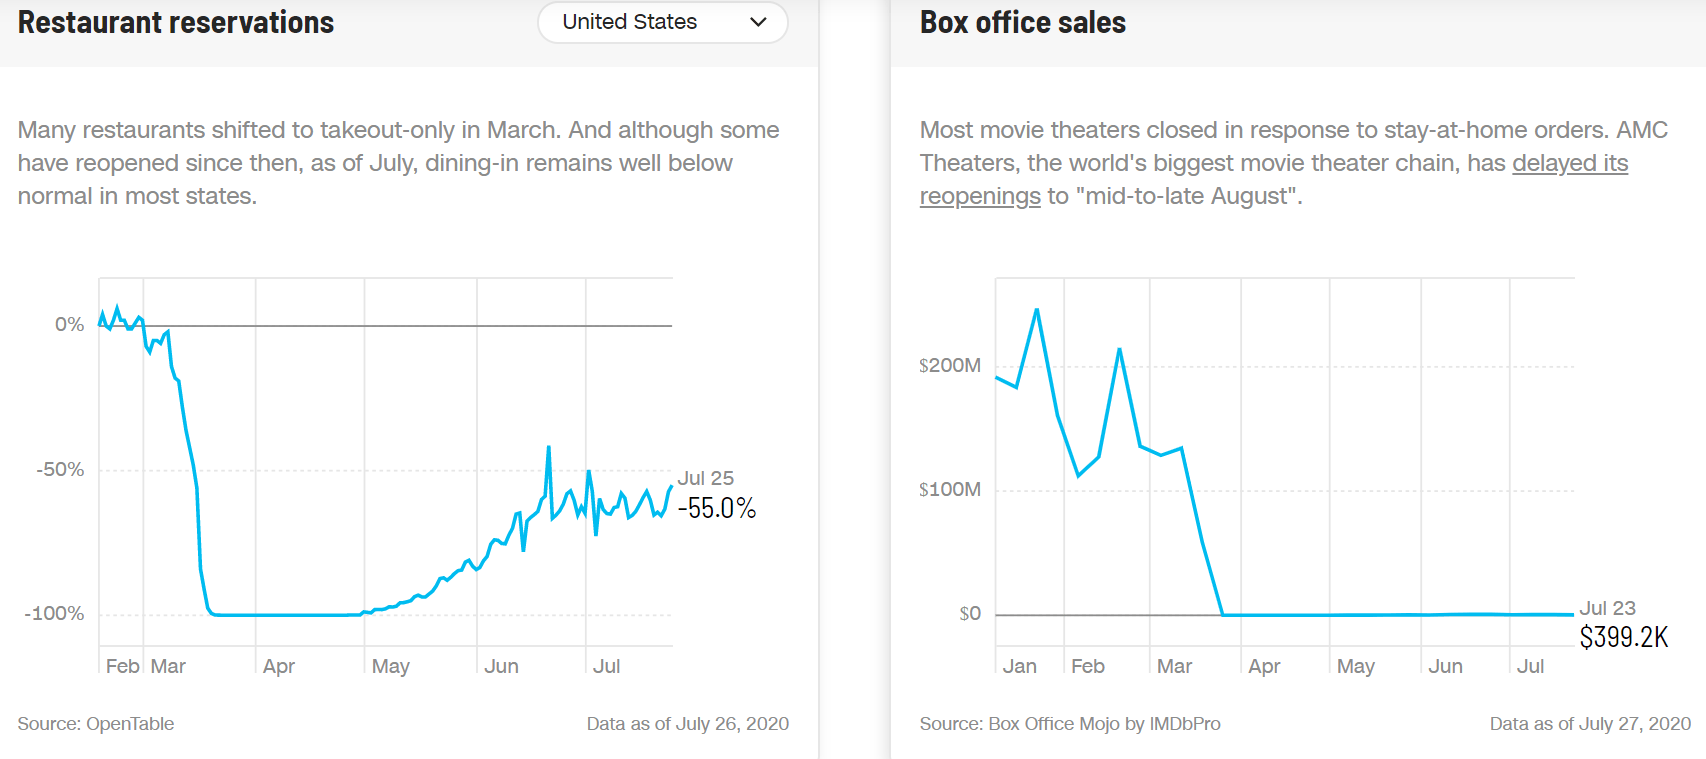
The first $1200 stimulus checks were spent on essentials, with about 33% saved and used to pay down credit card debt. Sky-high savings are prudent for families facing unprecedented economic insecurity but are determinantal to hopes of a fast economic recovery. Surging cases in most states have understandably crushed restaurants and movie theaters which consumers had recently told pollsters are not safe to go to.
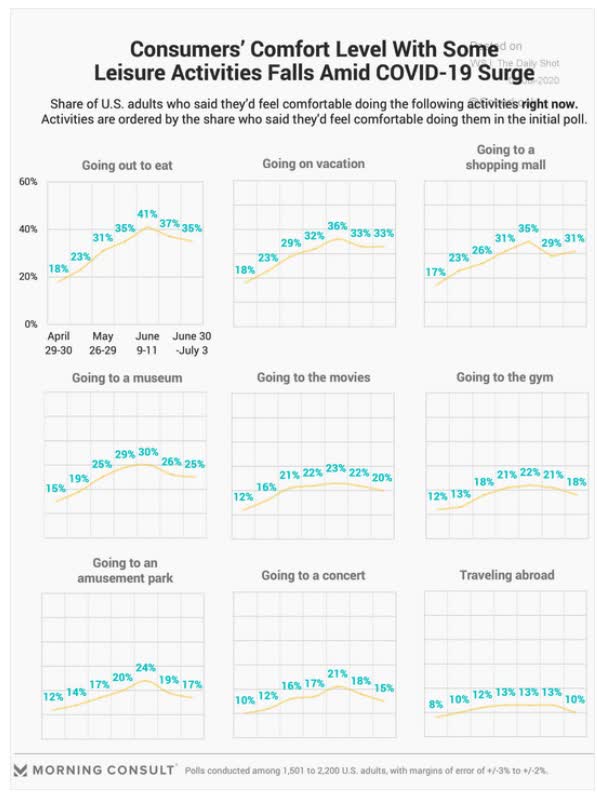
So it’s not surprising that reservation and box office data has stalled at such awful levels.
(Source: CNN economy tracker)
Travel and leisure industries like airlines and hotels have been crushed by this pandemic, and neither industry appears to be set for a rebound anytime soon.
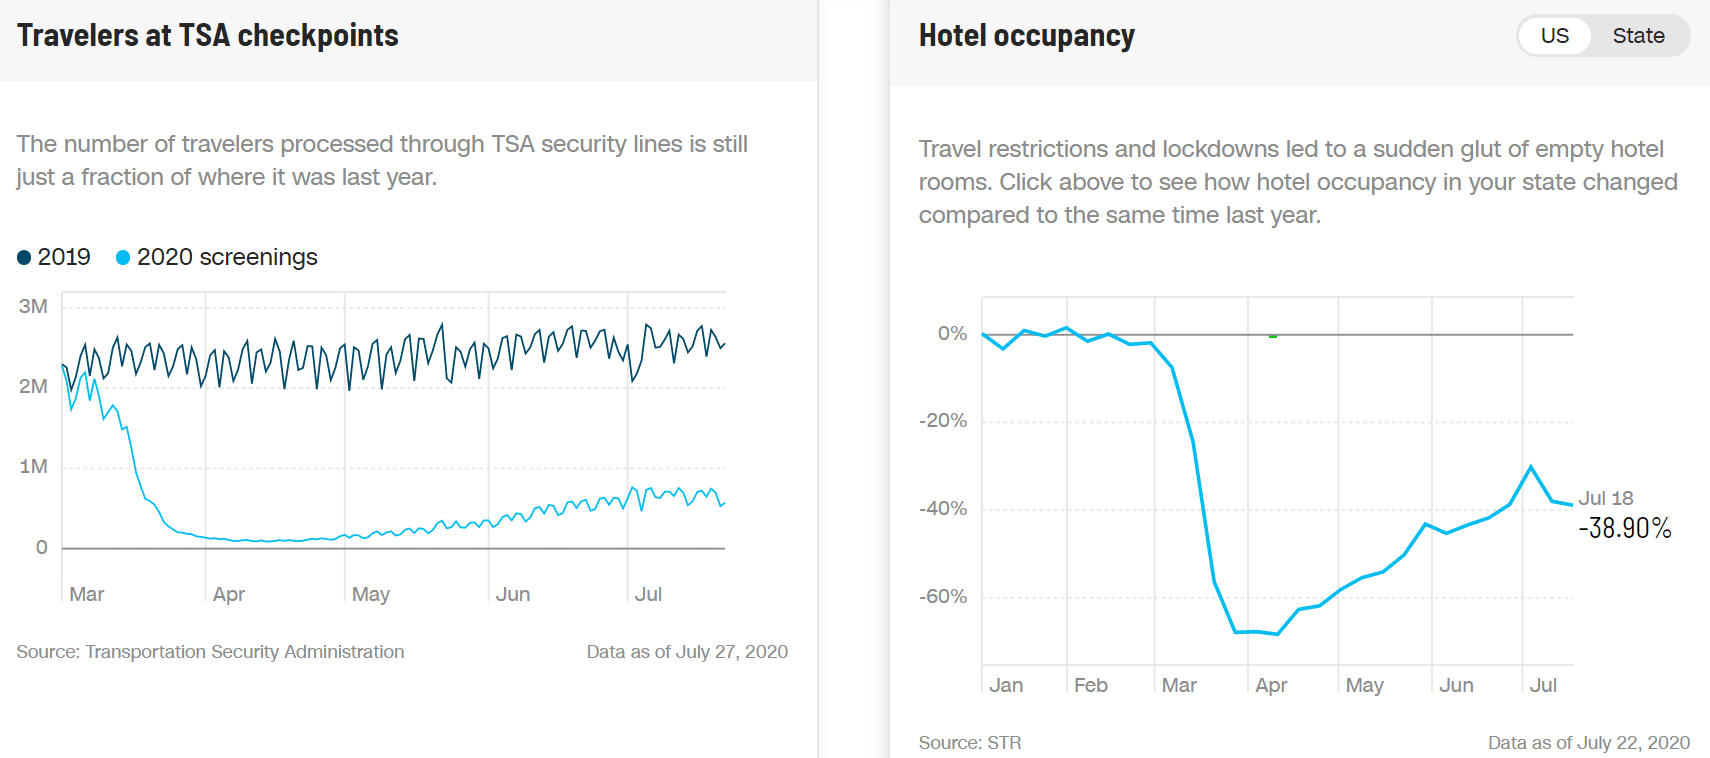
(Source: CNN economy tracker)
These consumer-facing high-frequency indicators are now starting to show up in the macroeconomic data as well. We can see this in the NY/Dallas Fed’s/Harvard weekly economic index which tracks 10 daily/weekly economic reports and estimates how fast the economy is growing in the previous week.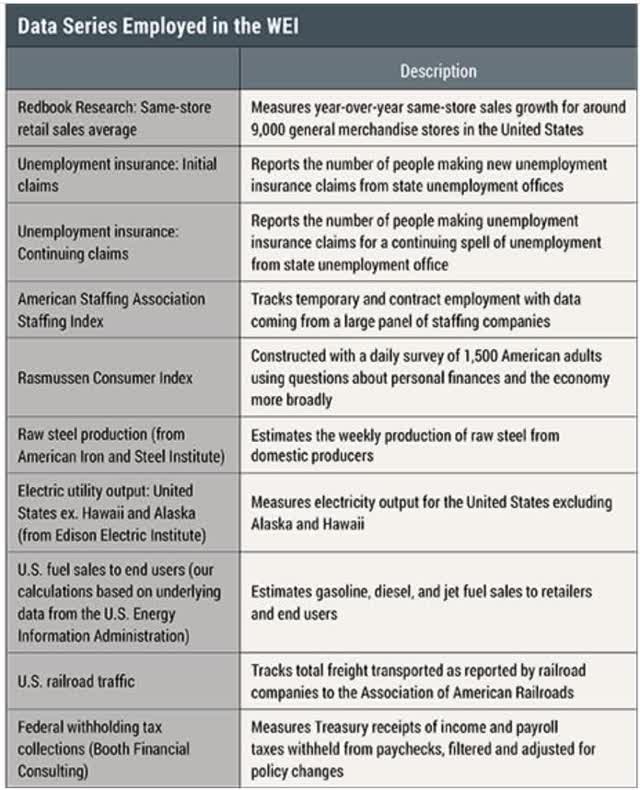
(Source: New York Fed, Dallas Fed, Harvard)
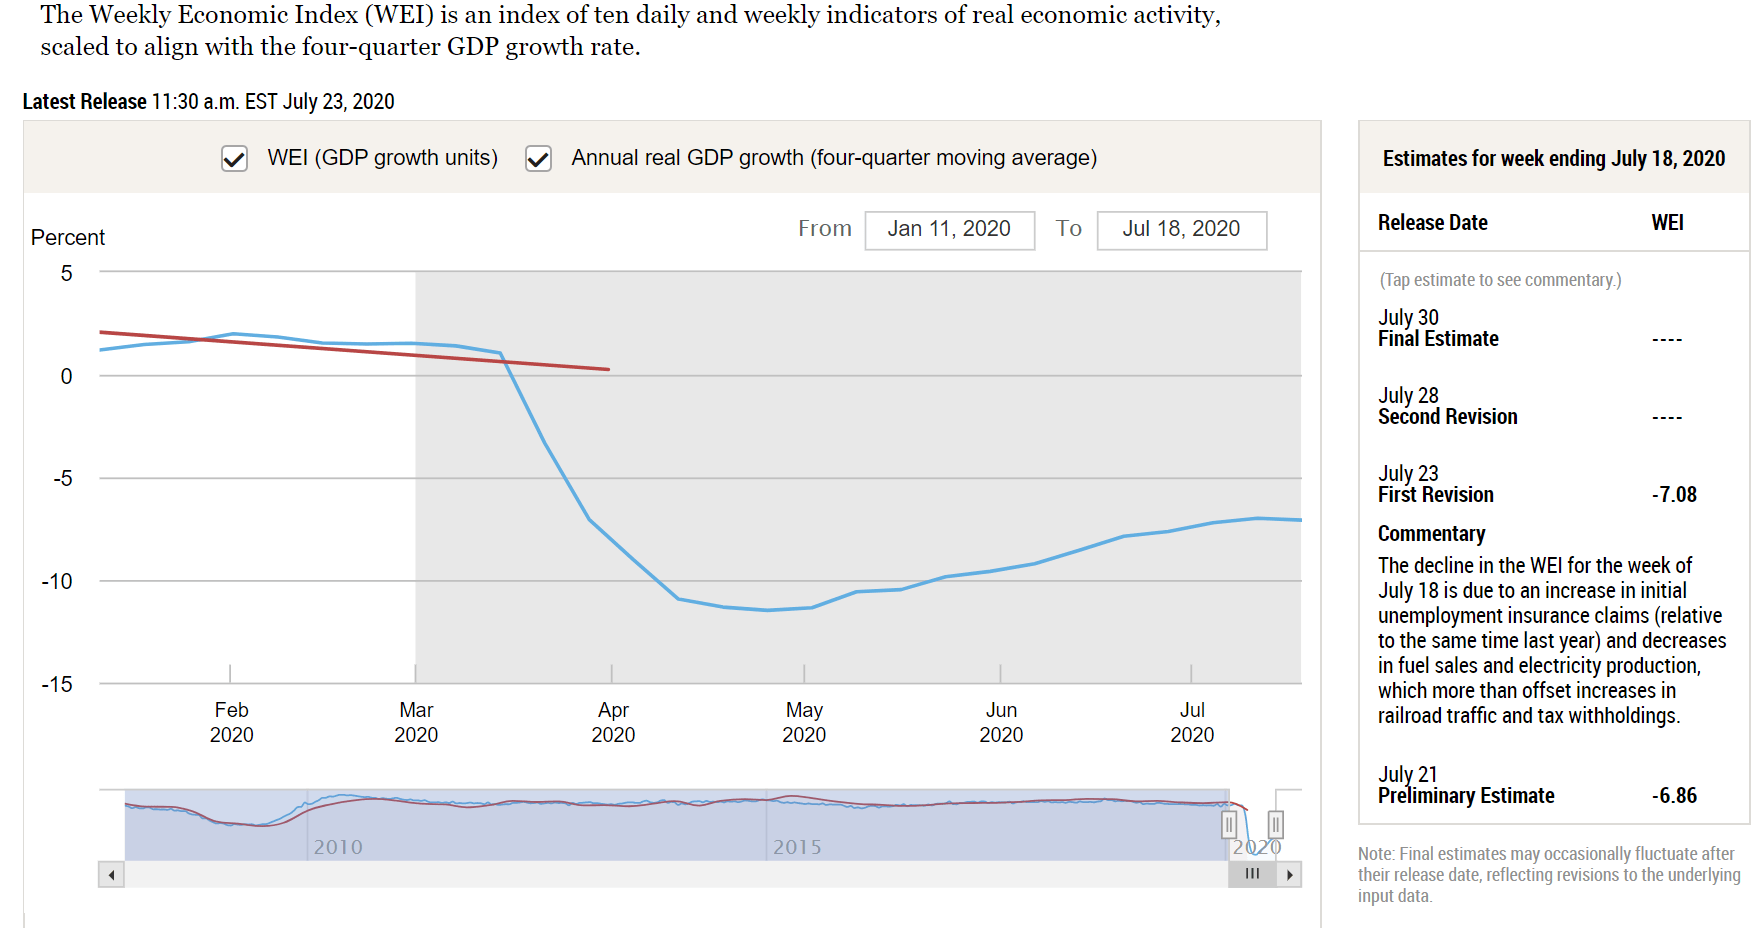
The decline in the WEI for the week of July 18 is due to an increase in initial unemployment insurance claims (relative to the same time last year) and decreases in fuel sales and electricity production, which more than offset increases in railroad traffic and tax withholdings. – New York Fed, Dallas Fed, Harvard)
The weekly economic index fell for the first time in weeks, to -28.4% GDP growth (annualized basis as this data is always reported) for Q2. The most optimistic thing we can say about the shape of the recovery so far is that it’s “swoosh” shaped, but definitely not V-shaped.
But as I’ll explain in part two of this series, August could bring much worse economic news, that could batter already beaten down small businesses and households, who have very little, or no reserves left right now. In fact, the next two weeks represent the highest risk period for the economy in several months and could potentially have critically important implications for the economy, and ultimately the stock market, for the next several years.
Want More Great Investing Ideas?
9 “BUY THE DIP” Growth Stocks for 2020
SPY shares were trading at $323.69 per share on Wednesday morning, up $2.52 (+0.78%). Year-to-date, SPY has gained 1.60%, versus a % rise in the benchmark S&P 500 index during the same period.
About the Author: Adam Galas

Adam has spent years as a writer for The Motley Fool, Simply Safe Dividends, Seeking Alpha, and Dividend Sensei. His goal is to help people learn how to harness the power of dividend growth investing. Learn more about Adam’s background, along with links to his most recent articles. More...
More Resources for the Stocks in this Article
| Ticker | POWR Rating | Industry Rank | Rank in Industry |
| SPY | Get Rating | Get Rating | Get Rating |
| QQQ | Get Rating | Get Rating | Get Rating |
| DIA | Get Rating | Get Rating | Get Rating |