
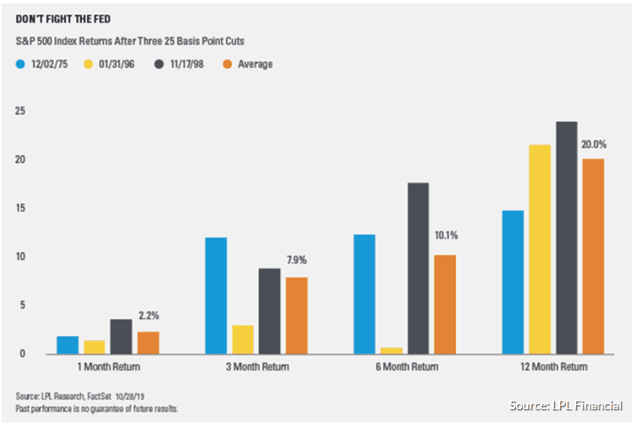
For good or ill, the market is obsessed with short-term interest rates. That’s not surprising given that of the three mid-cycle adjustments since 1975 (that prevented recessions) the S&P 500, on average, gained 20% within a year of the third cut.
Well, there is good news and bad news about interest rates in 2020, that could have important implications, not just for the market in general, but your portfolio in particular.
The Good News Is The Fed Is Set To Become More Dovish In 2020
In 2020, four new Fed presidents will rotate in Cleveland’s Mester, Philadelphia’s Harker, Dallas’ Kaplan, and Minneapolis’ Kashkari.
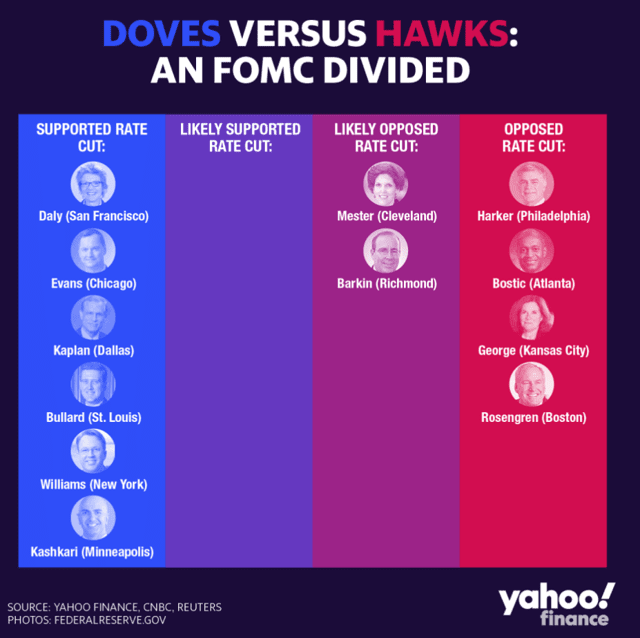
The new Fed Open Market Committee or FOMC, which decides what to do with short-term rates every six weeks, will be slightly more dovish than it is now. Not a lot more dovish mind you, but slightly more willing to cut rates if the data says the US economy is weakening enough to warrant it.
This might explain why the bond market is pricing in virtually no chances of a rate cut in December, but a 67% probability of at least one more cut next year, with about 27% probability of two cuts by December 2020.
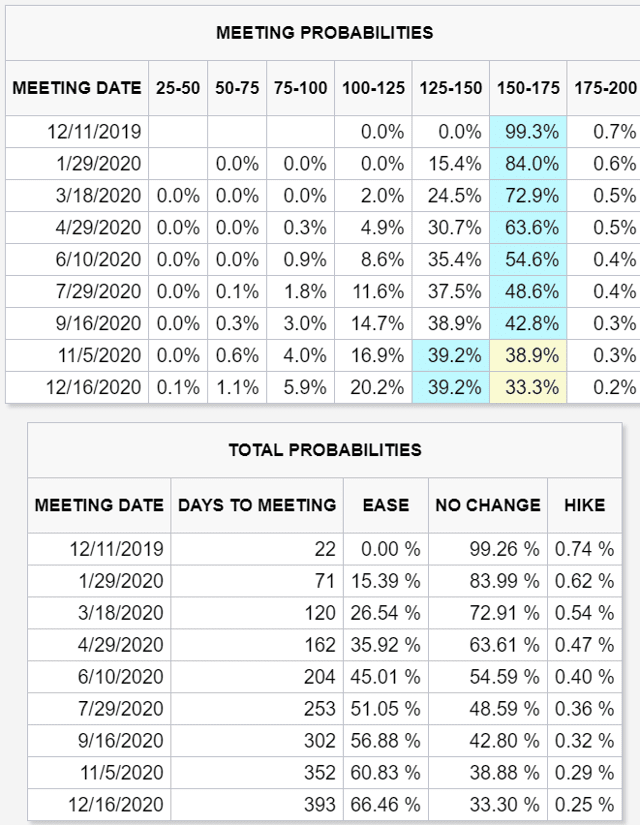
(Source: CME Group)
Moody’s estimates that each 25 bp cut in the Fed funds rate boosts GDP growth by 0.1% to 0.15% within a year of implementation.
With the Fed potentially still able to cut seven more times before hitting zero, that means about .7% to 1.05% worth of stimulus power left to help us avert a recession in 2020 or 2021.
So that’s the good news, but falling rates are not necessarily a panacea for stocks.
The Bad News Is That Interest Rates Falling Further Would Likely Be Bad News For Stocks
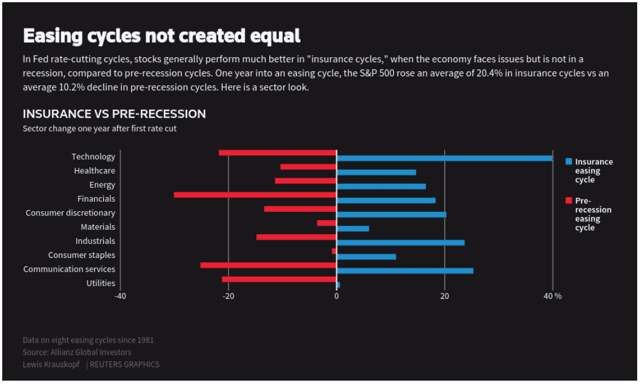
(Source: Reuters)
Since 1981, following eight easing cycles, large-cap stocks gain, on average, 15% in the year following the first “insurance” cut from the Fed (small caps on average saw a 28% gain). All sectors do well, but tech tends to dominate the gains.
BUT that’s only if the insurance cuts work and we avoid a recession. If a recession soon follows (no soft landing) then returns tend to be poor for all sectors. Defensive sectors like consumer staples and utilities do well, by falling less or staying flat.
What’s the economy look like now?
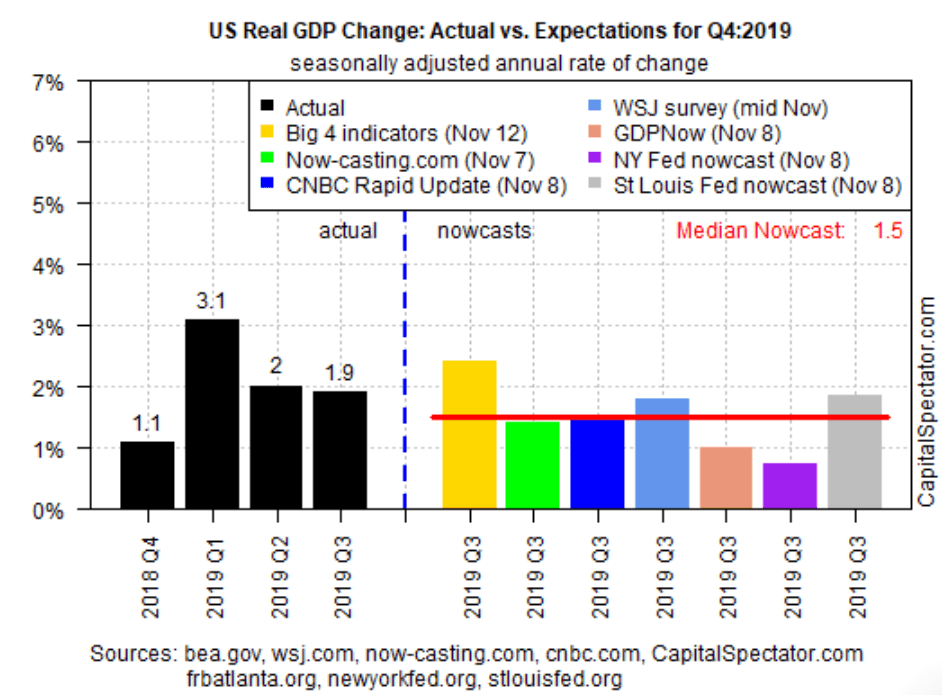
(Source: James Picerno, Jeff Miller)
It depends on what sources you look at. The New York Fed’s most recent estimate of Q4 GDP growth fell to 0.4% last week, due to weaker than expected industrial data. The Atlanta Fed’s estimate fell to just 0.3%, verging on recession.
The overall consensus of seven such models estimates 1.5% growth in Q4.
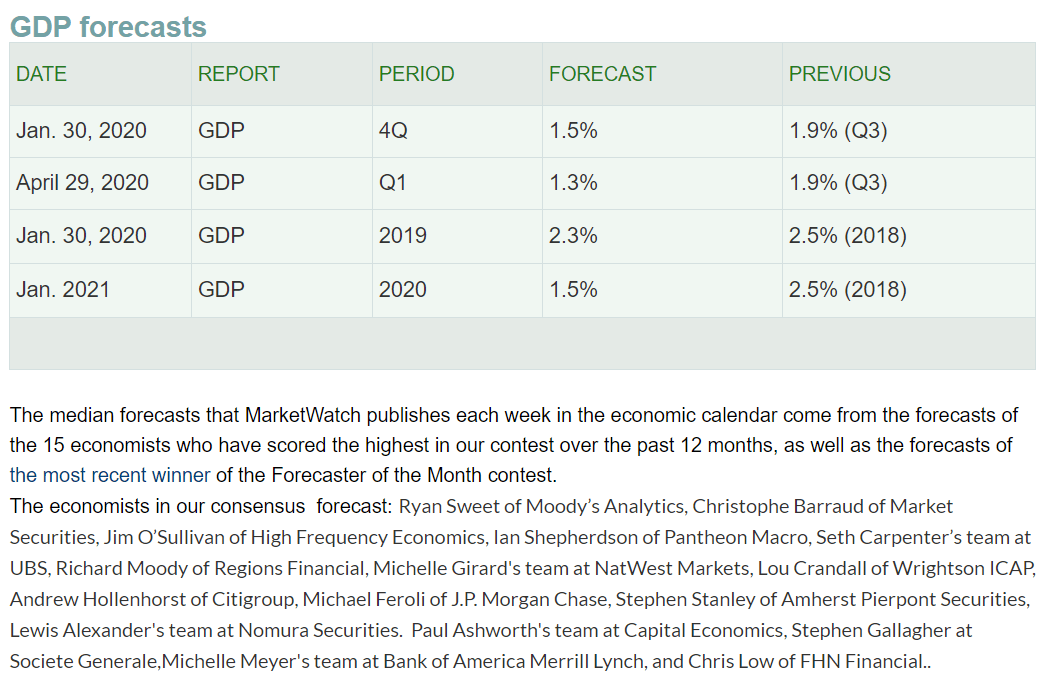
(Source: MarketWatch)
Q1 tends to be slightly weaker than Q4, due to lack of a holiday shopping season. Thus it’s not surprising that the most accurate economists, as tracked by MarketWatch, estimate Q1 2020 growth of just 1.3%. That is expected to rebound later in the year when growth is expected to clock in at 1.5% for the full year.
If true that would be the weakest growth since 2009, beating 2016’s recession scare year (caused by the oil crash) of 1.6% growth, and far below the 2.3% average, we’ve seen over the past decade.
Here’s why investors should care.
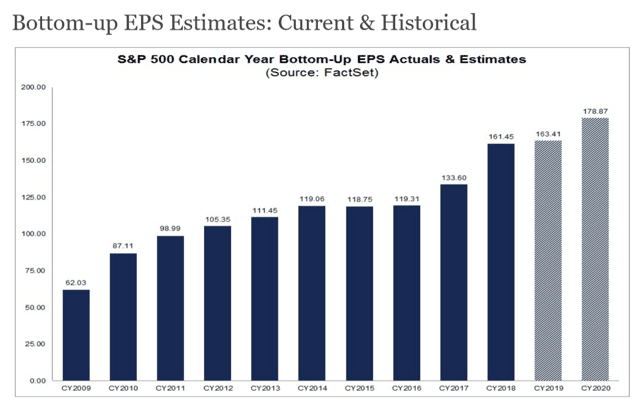
S&P 500 EPS Growth Consensus

(Source: Brian Gilmartin)
2018 saw earnings growth of about 20% (28% YOY growth in Q3 2018). Combined with the current trade war slowing global and US growth, that means 2019 has some very tough comps. This is why it’s not a surprise that the consensus S&P 500 EPS growth for 2019 ranges from 0% (FactSet Research) to +0.4% (IBES).
Note that in 2020 growth is expected to accelerate steadily every quarter, until peaking at 14.1% YOY in Q4 of next year. 2021 initial expectations are also set at double digits, with about 11% growth forecast by analysts.
I’m rather skeptical of those estimates and here’s why. From 2009 to 2019 (flat earnings year) S&P 500 EPS would have grown 10% CAGR.
That’s faster than the 20 year average of 6.5% and the 6% average since 1951. That’s to be expected since those longer-term averages have included several recessions, when, on average, corporate earnings fall 13%.
But note that 10% EPS growth from 2009 to 2019 wasn’t in a straight line. Growth exploded from 2009 to 2010, +40%, courtesy of 2009’s very weak results, caused by record bank losses during the Financial Crisis. In 2010 we saw strong but far less impressive 14% EPS growth and then things slowed down even more, until from 2014 to 2016 growth was basically zero.
2017 saw a huge surge in business confidence, courtesy of regulatory cuts and expectations of the biggest corporate tax cuts in almost 40 years. In 2018 those tax cuts helped deliver 35% EPS growth between 2016 and 2018.
What is the catalyst for 10% and 11% expected growth in 2020 and 2021? That would require significant margin expansion, of which we’ve seen an impressive amount during the past decade.
Might an end to the trade war help boost growth? Sure, but likely not until 2021, given that no final trade deal is likely in the first half of the year.
What about productivity growth? 5G and the rise of automation are certainly likely to help improve profit margins in the coming years, but not likely by 2021.
We also can’t forget that the labor market keeps getting tighter. Slow wage growth, about half as fast as normal over the last decade, is a major reason that corporate profit margins were able to steadily rise for so long.

Wage growth for non-supervisory workers (80% of employees) was 3.5% in October and the Atlanta’ Fed 3 month rolling average of median wage growth (factors out retiring baby boomers) is also at 3.5%.
While wage growth doesn’t move in a straight line, as long as monthly net job growth is above 107K (according to Charles Schwab), the labor market will keep tightening. This should keep wage growth tracking slowly but steadily higher, making corporate margin expansion harder.
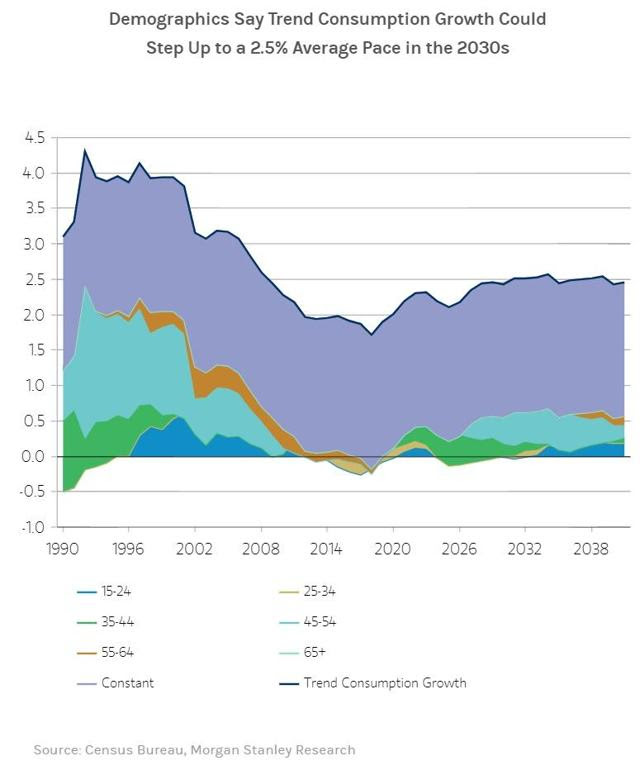
The good news is that Morgan Stanley (and other asset managers) estimate that 151 million Millenials and Gen Z (about double the 76 million boomer generation) should kick off a “youth boom” in the 2020s that should run through 2040.
About 0.7% stronger annual spending growth, due to family formations, could drive 2.5% to 3% long-term economic growth. That’s a lot stronger than the 1.7% the Congressional Budget Office and Fed expect, and would be slightly better than economic growth over the last decade.
But those are secular tailwinds we’ll be facing in the coming decades, and not likely a cause of double-digit earnings growth in 2020 and 2021, especially with no final phase three trade deal likely by November 2020. Moody’s estimates just a 15% probability of that, an assessment I concur with.
So where does that leave stock investors at the end of 2019? History says we should get about a 20% rally from October 2019 to October 2020. However, the forward PE on the S&P 500 is now 18.1, about 12% historically overvalued relative to the 25-year average of 16.2.
If you adjust for low-interest rates, using the 4% average earnings yield risk-premium since 2000, then a 17.2 forward PE would be “fair value” for the S&P 500, implying stocks are about 5% overvalued. Analyst firm Bespoke agrees, with its model saying stocks are currently overpriced by 6%.
Bespoke, using the 10% EPS growth consensus, estimates the S&P 500 will be up about 9.6% within a year. That’s close to the market’s historical return (9.1% CAGR since 1871). While that might sound fine, it’s certainly less exciting than the 20% average gain some media outlets might lead you to believe is coming after three rate cuts.
And of course, if the December trade talks (for phase 1 of the US/China trade deal) fall apart, then forward growth estimates are likely to fall rapidly.
Meanwhile, investor sentiment is getting rather bullish.
(Source: Jeff Miller)
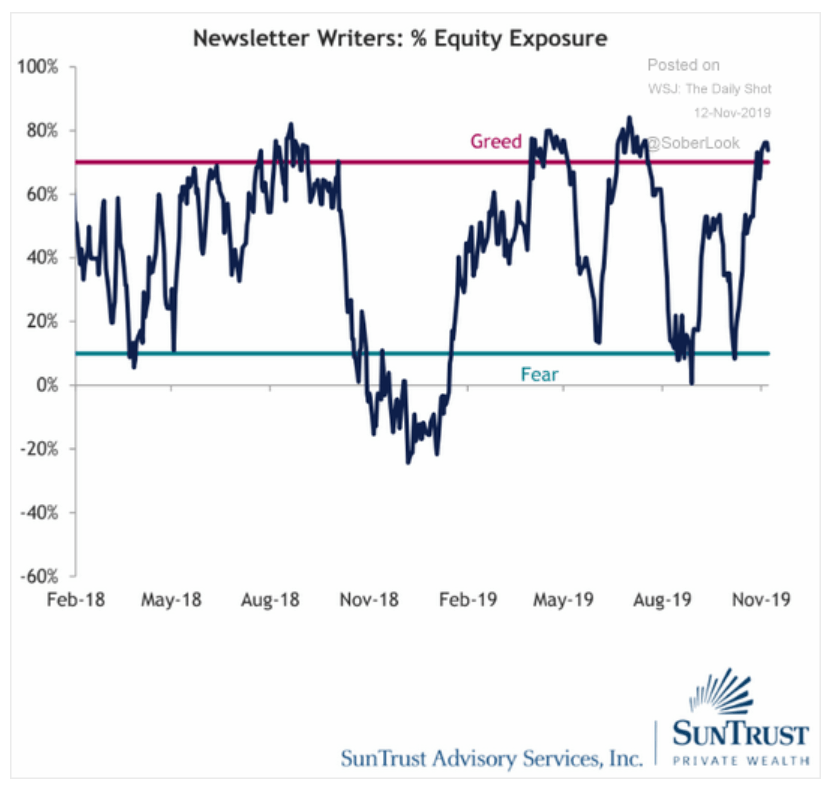
SunTrust’s index of investment newsletters reports some of the highest recommended equity exposure for the last two years. Note that in December 2018, when the forward PE on the S&P 500 hit 13.7, the consensus among investment newsletters was to be net SHORT the market by 20%.
Essentially, sentiment is a contrarian indicator that climbs highest right when stocks are most at risk of a pullback or correction.

(Source: CNN)
The CNN Fear and Greed Index consists of seven technical indicators (like VIX, put/call ratios, and market momentum) and is currently 83, an elevated level that indicates “extreme greed”.
It needs to be pointed out that in 2017 the CNN index hit a far higher level, and was volatile, with the S&P 500 rising 14 straight months and never falling more than 2.5% from record highs.
Sentiment and valuations can only tell you when pullback risk is high and valuations are relatively accurate for forecasting long-term (5+ years) total returns. They can’t tell you when a correction might begin or how bad it will be.
Bottom Line: A More Dovish Fed in 2020 Will Slightly Lower Recession Risk…But Investors Need To Have Modest Return Expectations
For anyone concerned about recessions (and recessionary bear markets), the good news is that currently 12-month recession risk is about 27%, and it appears that the trade war-induced mild manufacturing recession won’t tank the US economy.
The Fed will likely become slightly more willing to cut next year if the economic data does take a turn for the worse (such as from a failed December trade deal).
And while 2020 earnings growth isn’t likely to hit 10% as the current consensus estimate forecasts, 6% to 7% earnings growth would be reasonable given the 1.5% GDP growth that is likely coming.
That could be enough to send stocks modestly higher next year, after the second-best annual rally since 2009. However, investors need to understand three things
- if the Fed cuts more next year, it’s likely because the trade talks have failed, recession risk is soaring and stocks aren’t likely to do well (so don’t root for this)
- corporate earnings growth is likely to be far weaker than most analysts currently forecast (so take those 10% 12-month consensus rally estimates with a grain of salt)
- elevated valuations and hyper bullish sentiment right now means pullback risk (historically about 7% decline over one month) is now high, historically likely to start by the end of April 2020, and nothing to worry about
Market timing is the second-worst strategy you can possibly use.
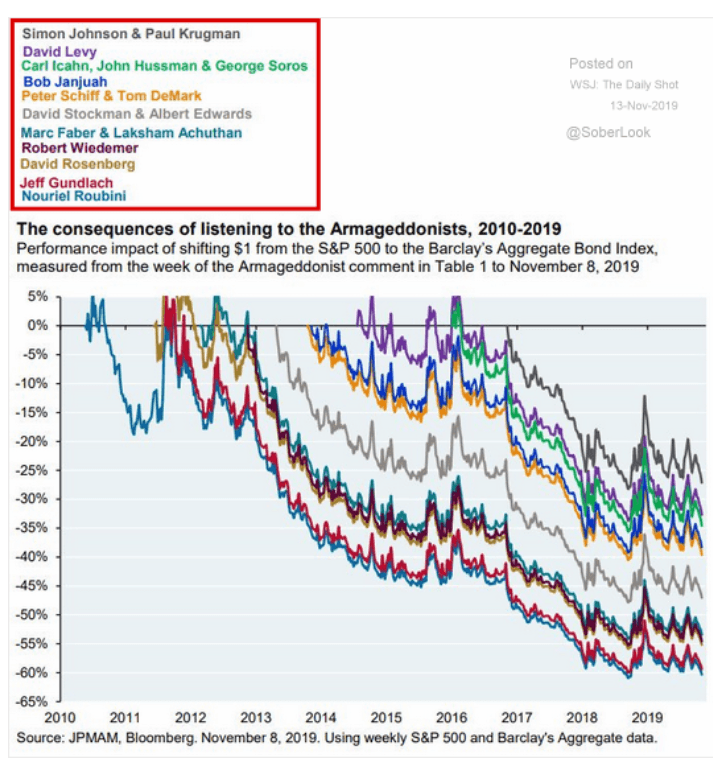
The only dumber use of your money is following the advice of permabear doomsday prophets who have been predicting 50% market crashes for the past decade.
(Source: Jeff Miller)
Even when the doomsday analysts are right (like 2000 and 2008) they tend to deliver abysmal returns over the long-term. John Hussman, the famous hedge fund manager who made a mint in 2008, is calling for, yet again, a 65% market crash.
Hussman Strategic Total Return Fund Returns Since 2000 Inception

(Source: Morningstar)
Over the past 20 years, Hussman’s mega-meltdown predictions were right twice. And his investors still lost money over 20 years, underperforming the market timing long-only retail investor by 2% annually for half an investing lifetime.
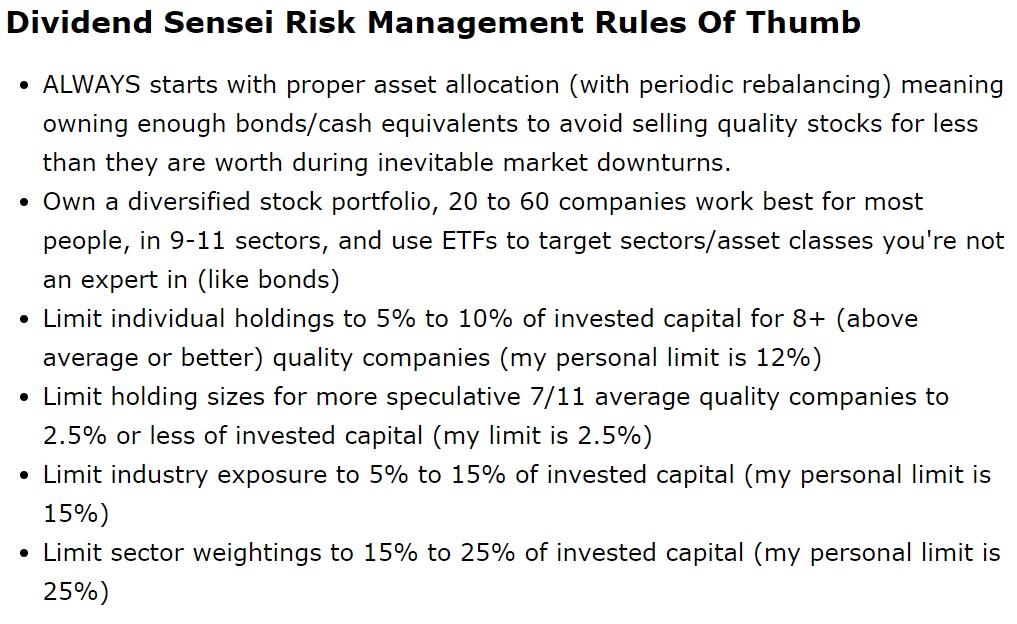
Risk management is the way to protect your wealth from whatever happens in the future. If you follow a reasonable and prudent approach that fits your needs, risk profile and goals, with discipline and consistency, then you don’t have to obsess over interest rates, the economy, or how fast corporate profits grow in any given year.
SPY shares were trading at $311.63 per share on Wednesday morning, down $0.30 (-0.10%). Year-to-date, SPY has gained 26.43%, versus a % rise in the benchmark S&P 500 index during the same period.
About the Author: Adam Galas

Adam has spent years as a writer for The Motley Fool, Simply Safe Dividends, Seeking Alpha, and Dividend Sensei. His goal is to help people learn how to harness the power of dividend growth investing. Learn more about Adam’s background, along with links to his most recent articles. More...
More Resources for the Stocks in this Article
| Ticker | POWR Rating | Industry Rank | Rank in Industry |
| SPY | Get Rating | Get Rating | Get Rating |


