
- The market expected another small 11 bcf injection into storage
- The peak inventory level for the injection season moves higher, and a streak ends
- Georgia and weather over the coming weeks will determine that path of natural gas prices as it sits below $2.60 per MMBtu
It looked like the week ending on October 23 brought the peak in natural gas inventories in storage across the United States so far. The stockpiles rose to a high of 3.955 trillion cubic feet. Stocks fell the following week by 36 bcf. An early cold snap across the US caused the first withdrawal of the peak season for demand.
Meanwhile, inventories marginally rose for the week ending November 6 as the Energy Information Administration reported an increase of eight bcf into storage as warmer temperatures returned.
On Thursday, November 19, the EIA reported stockpiles for the week ending on November 13. The peak from October 23 will not stand as the high going into the winter months in 2020/2021. The weekly injection was higher than expected. According to Baker Hughes, the natural gas rig count stood at 73 as of November 13, two higher than the previous week, but 56 lower than in mid-November 2019 when 129 rigs extracted natural gas from the earth’s crust in the US. The lower rig count means that production has declined as we head into the peak season for demand. Meanwhile, the expanding export business has increased the demand side of the fundamental equation for natural gas.
The United States Natural Gas Fund (UNG) tracks the price action in the natural gas futures market, which suffered a significant decline since November 2. Over the past week, the price fell to a low of $2.525 per MMBtu on the December futures contract. The December contract price fell to $2.637 in late June when the nearby contract hit its twenty-five-year low at $1.432 per MMBtu.
The market expected another small 11 bcf injection into storage
At the end of the injection season, inventory changes tend to be marginal. After an injection of only eight billion cubic feet last week, the EIA told the natural gas market that stockpiles rose by a more than projected eleven bcf for the week ending on November 13.
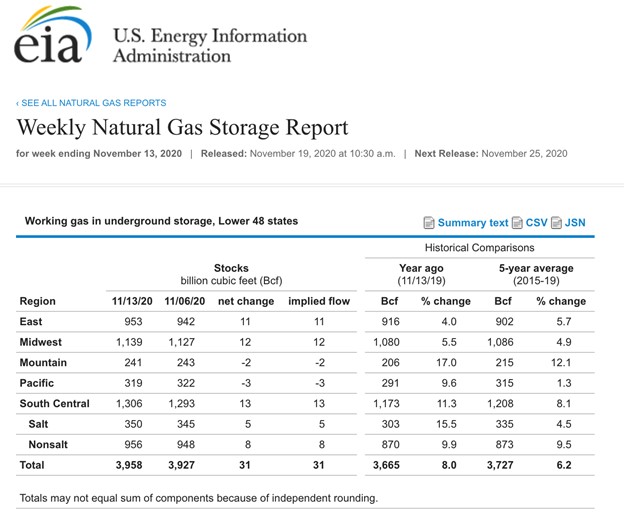
Source: EIA
As the chart highlights, stockpiles rose by 31 bcf, pushing total stocks to 3.958 trillion cubic feet. Inventories are were 8% above last year’s level and 6.2% higher than the five-year average for mid-November. The chart also shows plenty of natural gas is available to meet the winter heating requirements across all regions.
The peak inventory level for the injection season moves higher, and a streak ends
The injection season is still alive in the natural gas market as the total level of inventories rose to a new high in the latest report. Time will tell if 3.958 tcf will stand as the peak or if an even higher level is on the horizon in next week’s report. The latest indication from Estimize, the crowdsourcing website, is that the market expects stocks to decline by around 23 bcf as of November 20.
Meanwhile, the percentage of natural gas inventories above last year’s level had declined over thirty-two consecutive weeks from March through November 6. The percentage dropped steadily from 79.5% over the prior year’s level to 5.3%. The latest stockpile data was the first increase since March that ended the streak and pushed the percentage to 8% over last year’s level.
Georgia and weather over the coming weeks will determine that path of natural gas prices as it sits below $2.60 per MMBtu
Natural gas has had a rough November, and things went from bad to worse for the bulls this week.
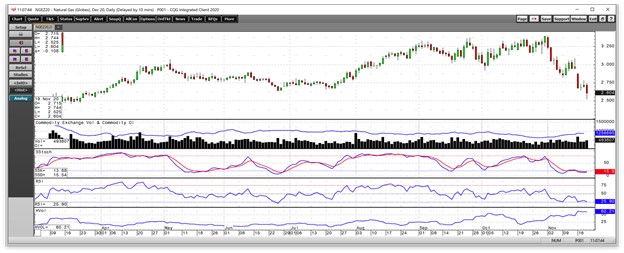
Source: CQG
As the daily chart of December NYMEX natural gas futures illustrates, the price hit a high of $3.396 per MMBtu on November 2, the highest price since January 2019 and above the peak of $2.905 going into the 2019/2020 withdrawal season last November. Since then, the price has dropped steadily. On Monday, November 16, natural gas gapped lower from a low of $2.949 on November 13 to a high of $2.887 at the start of this week. Natural gas continued to decline, reaching its latest low at $2.525 on November 19. The low came after the EIA’s latest inventory data, but the price bounced back towards the $2.60 level by midday on Thursday.
The future of US energy policy is now in the hands of Georgia’s voters as they will determine the balance of power in the US Senate. A majority of Democrats would likely allow for a stricter regulatory environment and greener approach to production, limiting or banning fracking, which would cause the output to decline.
Meanwhile, the weather across the US during the winter months will have the most significant short-term impact on the natural gas price. Temperatures warmed up in early November after a cold snap in late October, which caused selling to return to the natural gas market.
Natural gas is one of the most volatile commodities that trade on the futures exchange. Anyone who trades the energy commodity knows that expecting the unexpected is always the best approach to the natural gas market. Price explosions and implosions are the norms rather than the exceptions.
Want More Great Investing Ideas?
9 “MUST OWN” Growth Stocks for 2021
Why Investors DON’T Care About Covid-19 Anymore
5 WINNING Stocks Chart Patterns
UNG shares were trading at $9.88 per share on Thursday afternoon, down $0.40 (-3.89%). Year-to-date, UNG has declined -41.40%, versus a 12.18% rise in the benchmark S&P 500 index during the same period.
About the Author: Andrew Hecht

Andy spent nearly 35 years on Wall Street and is a sought-after commodity and futures trader, an options expert and analyst. In addition to working with StockNews, he is a top ranked author on Seeking Alpha. Learn more about Andy’s background, along with links to his most recent articles. More...
More Resources for the Stocks in this Article
| Ticker | POWR Rating | Industry Rank | Rank in Industry |
| UNG | Get Rating | Get Rating | Get Rating |