

Don’t trust forward earnings? Well then consider the S&P 500’s trailing PE ratio, which today is 21.7. Sounds very high right? Especially since 1871, the average has been 15.7. But consider this, the average TTM PE for the market has been 20.2 over the past 40 years.
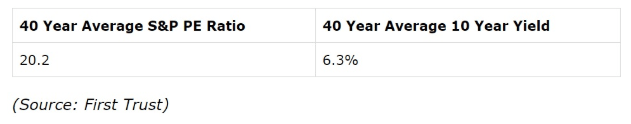
And that was when the average 10 year-yield was 6.3%. With long-term rates now at less than half that, 21.7 trailing earnings (which are falling rapidly due to tax cut boosted earnings in 2018) is far from “bubble levels”.
So what does that mean about this most recent market fall? Only that it’s likely to be a regular pullback or a correction. Since WWII there have been 57 pullbacks of 5% to 9.9% from the S&P 500’s all-time-high. On average they lasted 1 month (so this one is already overdue to end) and saw a max decline of 7% (9.9% was October 29th low). What if this becomes a correction?
(Source: Wealthfront)
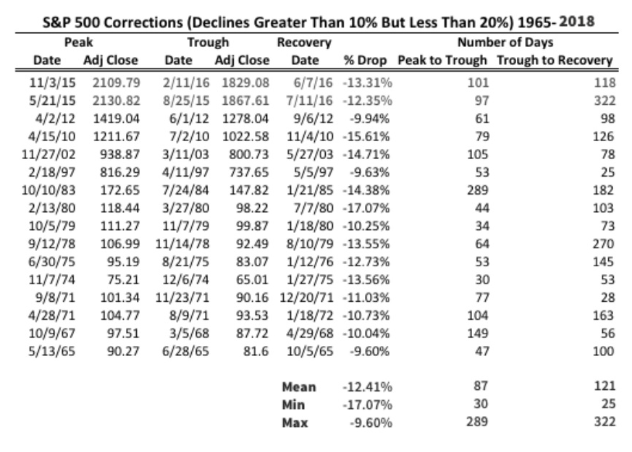
Well since 1965 those last, on average, three months, and see stocks decline 12.4%. But the duration of the correction is actually a function of how low stocks fall (because bargain hunters step in to put a bottom in when prices hit a certain point). As of yesterday the S&P 500 was down 8.2% from its September 20th high. Thus IF we end up falling into a correction (still technically just a pullback) then stocks likely have only about 4% more to fall. That’s before attractive valuations and solid economic and earnings fundamentals cause them to rise once more to new all-time highs just four months later (historical average recovery time).
Or to put another way, IF this becomes a correction then selling now is likely selling close to the bottom, which is the best way to lose money.
About the Author:

9 "Must Own" Growth Stocks For 2019
Get Free Updates
Join thousands of investors who get the latest news, insights and top rated picks from StockNews.com!
Top Stories on StockNews.com
Best & Worst Performing Stock Industries for April 18, 2024
Led by ticker KGJI, "Fashion & Luxury" was our best performing stock industry of the day, with a 1,298.79% gain.
Best & Worst Performing Small Cap Stocks for April 18, 2024
KGJI leads the way today as the best performing small cap stock, closing up 100,000.00%.
Best & Worst Performing Large Cap Stocks for April 18, 2024
UAL leads the way today as the best performing large cap stock, closing up 17.45%.
Best & Worst Performing Mid Cap Stocks for April 18, 2024
ROYMY leads the way today as the best performing mid cap stock, closing up 22.58%.