
Applied Optoelectronics, Inc. (AAOI): Price and Financial Metrics
AAOI Price/Volume Stats
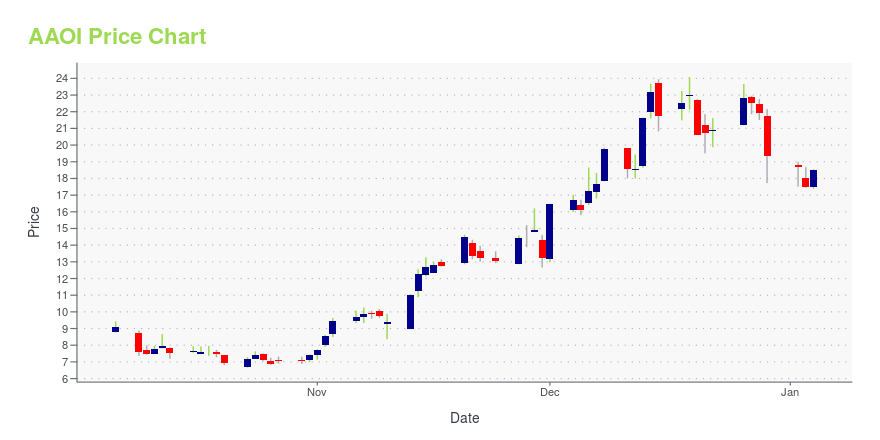
| Current price | $12.12 | 52-week high | $24.75 |
| Prev. close | $11.66 | 52-week low | $1.60 |
| Day low | $11.58 | Volume | 2,104,900 |
| Day high | $12.44 | Avg. volume | 2,853,712 |
| 50-day MA | $14.94 | Dividend yield | N/A |
| 200-day MA | $13.46 | Market Cap | 465.38M |
AAOI Stock Price Chart Interactive Chart >
Applied Optoelectronics, Inc. (AAOI) Company Bio
Applied Optoelectronics is a developer and manufacturer of advanced optical products, including components, modules and equipment, all of which is used for broadband fiber access networks. The company was founded in 1997 and is based in Sugar Land, Texas.
Latest AAOI News From Around the Web
Below are the latest news stories about APPLIED OPTOELECTRONICS INC that investors may wish to consider to help them evaluate AAOI as an investment opportunity.
While institutions own 46% of Applied Optoelectronics, Inc. (NASDAQ:AAOI), retail investors are its largest shareholders with 49% ownershipKey Insights Significant control over Applied Optoelectronics by retail investors implies that the general public has... |
Applied Optoelectronics' Subsidiary Global Technology Inc. Filed Patent Infringement Lawsuits Against CreaLights in ChinaSUGAR LAND, Texas, Dec. 22, 2023 (GLOBE NEWSWIRE) -- Applied Optoelectronics, Inc. (Nasdaq: AAOI, hereinafter “AOI”), a leading provider of fiber-optic access network products for the cable broadband, internet datacenter, telecom and fiber-to-the-home (FTTH) markets, today announced that its subsidiary Global Technology Inc (hereinafter “Global Technology”) has filed two lawsuits for patent infringement against Suzhou CreaLights Optoelectronics Technology Co., Ltd. (hereinafter “CreaLights”) in |
3 Stock Winners That Are Up 500% or More in 2023If you want to find 2023's top-performing stock, check out these companies that returned 500% or more since January |
These 9 Micro/Small Cap AI Stocks Continue In Bubble Mode9 micro/small cap AI stocks are still in bubble mode advancing 14.8%, on average, last week. In comparison, the Global X Artificial Intelligence & Technology ETF was only up 0.5% and the iShares Semiconductor ETF was only up 1.6%. |
7 Stock Winners That Are Up 1,000% or More in 2023Could any or all of these seven stocks up 1000% this year go on another hot run during 2024? |
AAOI Price Returns
| 1-mo | -18.77% |
| 3-mo | -23.34% |
| 6-mo | 69.04% |
| 1-year | 466.36% |
| 3-year | 53.03% |
| 5-year | -2.02% |
| YTD | -37.27% |
| 2023 | 922.22% |
| 2022 | -63.23% |
| 2021 | -39.60% |
| 2020 | -28.37% |
| 2019 | -23.01% |
Continue Researching AAOI
Want to see what other sources are saying about Applied Optoelectronics Inc's financials and stock price? Try the links below:Applied Optoelectronics Inc (AAOI) Stock Price | Nasdaq
Applied Optoelectronics Inc (AAOI) Stock Quote, History and News - Yahoo Finance
Applied Optoelectronics Inc (AAOI) Stock Price and Basic Information | MarketWatch
Loading social stream, please wait...