Arch Capital Group Ltd. (ACGL): Price and Financial Metrics
ACGL Price/Volume Stats
Current price | $81.85 | 52-week high | $90.65 |
Prev. close | $81.99 | 52-week low | $59.10 |
Day low | $81.28 | Volume | 1,211,200 |
Day high | $82.50 | Avg. volume | 1,951,526 |
50-day MA | $83.64 | Dividend yield | N/A |
200-day MA | $76.05 | Market Cap | 30.54B |
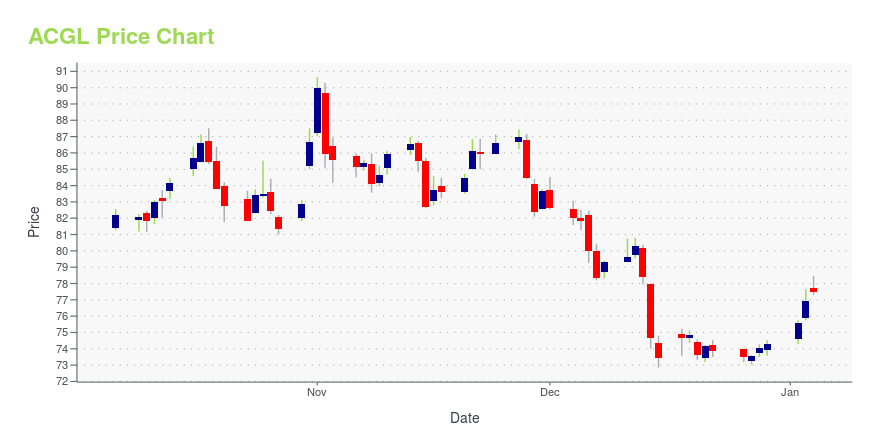
ACGL Stock Price Chart Interactive Chart >
ACGL POWR Grades
- Momentum is the dimension where ACGL ranks best; there it ranks ahead of 96.11% of US stocks.
- The strongest trend for ACGL is in Quality, which has been heading down over the past 177 days.
- ACGL ranks lowest in Value; there it ranks in the 30th percentile.
ACGL Stock Summary
- With a market capitalization of $30,835,194,841, ARCH CAPITAL GROUP LTD has a greater market value than 92.14% of US stocks.
- Over the past twelve months, ACGL has reported earnings growth of 136.06%, putting it ahead of 91.7% of US stocks in our set.
- As for revenue growth, note that ACGL's revenue has grown 43.76% over the past 12 months; that beats the revenue growth of 89.43% of US companies in our set.
- Stocks with similar financial metrics, market capitalization, and price volatility to ARCH CAPITAL GROUP LTD are CCEP, DLTR, GIS, HSY, and BRO.
- ACGL's SEC filings can be seen here. And to visit ARCH CAPITAL GROUP LTD's official web site, go to www.archcapgroup.com.
ACGL Valuation Summary
- ACGL's price/sales ratio is 2.5; this is 150% higher than that of the median Financial Services stock.
- Over the past 243 months, ACGL's EV/EBIT ratio has gone up 5.4.
Below are key valuation metrics over time for ACGL.
Stock | Date | P/S | P/B | P/E | EV/EBIT |
---|---|---|---|---|---|
ACGL | 2023-11-28 | 2.5 | 2.1 | 10.8 | 9.9 |
ACGL | 2023-11-27 | 2.6 | 2.1 | 11.1 | 10.2 |
ACGL | 2023-11-24 | 2.5 | 2.1 | 11.0 | 10.2 |
ACGL | 2023-11-22 | 2.5 | 2.1 | 11.0 | 10.1 |
ACGL | 2023-11-21 | 2.5 | 2.1 | 11.0 | 10.1 |
ACGL | 2023-11-20 | 2.5 | 2.1 | 10.8 | 9.9 |
ACGL Growth Metrics
- Its 2 year revenue growth rate is now at 32.45%.
- The 4 year revenue growth rate now stands at 43.51%.
- Its 4 year net cashflow from operations growth rate is now at 89.01%.

The table below shows ACGL's growth in key financial areas (numbers in millions of US dollars).
Date | Revenue | Operating Cash Flow | Net Income to Common Stock |
---|---|---|---|
2022-09-30 | 8,855.909 | 3,633.721 | 1,199.774 |
2022-06-30 | 8,570.864 | 3,268.951 | 1,581.608 |
2022-03-31 | 8,926.018 | 3,216.273 | 1,851.268 |
2021-12-31 | 9,249.98 | 3,427.555 | 2,093.405 |
2021-09-30 | 9,323.436 | 3,182.606 | 2,013.465 |
2021-06-30 | 9,535.402 | 3,177.497 | 2,033.35 |
ACGL's Quality Factors
The “Quality” component of the POWR Ratings focuses on 31 different factors of a companies fundamentals and operational strength. Here are some key insights as we drill into the specifics of these quality attributes.- ACGL has a Quality Grade of C, ranking ahead of 57.05% of graded US stocks.
- ACGL's asset turnover comes in at 0.216 -- ranking 76th of 133 Insurance stocks.
- GBLI, HCI, and GTS are the stocks whose asset turnover ratios are most correlated with ACGL.
The table below shows ACGL's key quality metrics over time.
Period | Asset Turnover | Gross Margin | ROIC |
---|---|---|---|
2021-06-30 | 0.216 | 0.506 | 0.052 |
2021-03-31 | 0.216 | 0.484 | 0.044 |
2020-12-31 | 0.206 | 0.450 | 0.039 |
2020-09-30 | 0.197 | 0.441 | 0.035 |
2020-06-30 | 0.190 | 0.449 | 0.036 |
2020-03-31 | 0.184 | 0.476 | 0.042 |
ACGL Price Target
For more insight on analysts targets of ACGL, see our ACGL price target page. And for a list of of all stocks sorted by upside potential based on analyst target price, see our Top Price Target page.
Average Price Target | $47.91 | Average Broker Recommendation | 1.46 (Moderate Buy) |
Arch Capital Group Ltd. (ACGL) Company Bio
Arch Capital Group Ltd. (Arch Capital or ACGL) is an American Bermuda-based public limited liability company which writes insurance, reinsurance and mortgage insurance on a worldwide basis, with a focus on specialty lines, the segment of the insurance industry where the more difficult and unusual risks are written. It has operations in Bermuda, the United States, Canada, Europe, Australia and, in the case of mortgage insurance, Hong Kong. (Source:Wikipedia)
Latest ACGL News From Around the Web
Below are the latest news stories about ARCH CAPITAL GROUP LTD that investors may wish to consider to help them evaluate ACGL as an investment opportunity.
With EPS Growth And More, Arch Capital Group (NASDAQ:ACGL) Makes An Interesting CaseFor beginners, it can seem like a good idea (and an exciting prospect) to buy a company that tells a good story to... |
3 Top-Ranked Large Caps to Buy for a Steady ApproachLarge caps are found in nearly every portfolio, as their stable nature and successful track records are impossible to ignore. |
Top 5 Stocks With High ROE to Buy in a Volatile MarketNRG Energy (NRG), Thomson Reuters (TRI), Iron Mountain (IRM), Cboe Global Markets (CBOE) and Arch Capital (ACGL) are some of the stocks with high ROE to profit from in a volatile market |
Why Is Arch Capital (ACGL) Down 2.6% Since Last Earnings Report?Arch Capital (ACGL) reported earnings 30 days ago. What's next for the stock? We take a look at earnings estimates for some clues. |
Are Finance Stocks Lagging Arch Capital Group (ACGL) This Year?Here is how Arch Capital Group (ACGL) and American Homes 4 Rent (AMH) have performed compared to their sector so far this year. |
ACGL Price Returns
1-mo | -3.89% |
3-mo | 5.11% |
6-mo | 14.57% |
1-year | 35.20% |
3-year | 139.54% |
5-year | 195.06% |
YTD | 30.38% |
2022 | 41.24% |
2021 | 23.23% |
2020 | -15.90% |
2019 | 60.52% |
2018 | -11.69% |
Continue Researching ACGL
Want to do more research on Arch Capital Group Ltd's stock and its price? Try the links below:Arch Capital Group Ltd (ACGL) Stock Price | Nasdaq
Arch Capital Group Ltd (ACGL) Stock Quote, History and News - Yahoo Finance
Arch Capital Group Ltd (ACGL) Stock Price and Basic Information | MarketWatch
Loading social stream, please wait...