
Advantage Solutions Inc. (ADV): Price and Financial Metrics
ADV Price/Volume Stats
| Current price | $4.07 | 52-week high | $4.95 |
| Prev. close | $4.12 | 52-week low | $1.13 |
| Day low | $4.04 | Volume | 215,686 |
| Day high | $4.14 | Avg. volume | 631,718 |
| 50-day MA | $4.03 | Dividend yield | N/A |
| 200-day MA | $3.20 | Market Cap | 1.30B |
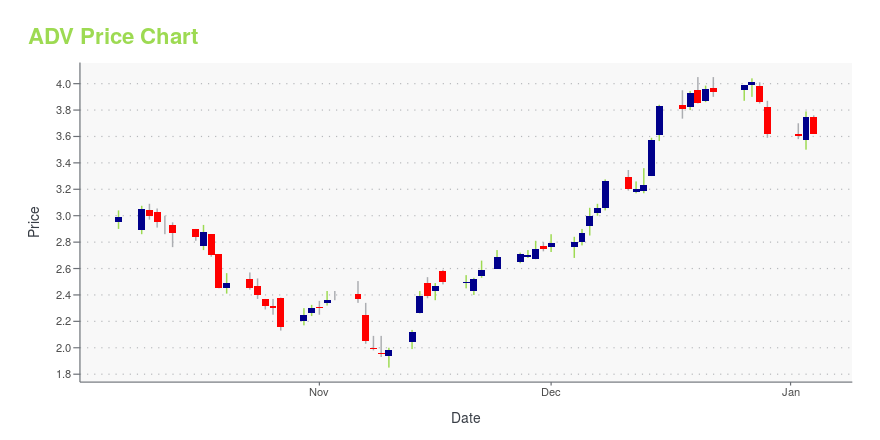
ADV Stock Price Chart Interactive Chart >
Advantage Solutions Inc. (ADV) Company Bio
Advantage Solutions Inc. provides promotions agency services to clients worldwide. It offers sales agency, marketing agency, technology agency, retail agency, international, and business services. Advantage Solutions Inc. was formerly known as Karman Holding Corp. and changed its name to Advantage Solutions Inc. in March 2016. The company was founded in 1987 and is based in Irvine, California.
Latest ADV News From Around the Web
Below are the latest news stories about ADVANTAGE SOLUTIONS INC that investors may wish to consider to help them evaluate ADV as an investment opportunity.
Is Advantage Solutions (ADV) Trading an Attractive Upside-To-Downside Ratio?Investment management company Curreen Capital released its third quarter 2023 Investor letter. A copy of the same can be downloaded here. In the third quarter, the fund was down 0.95% compared to -3.27% for the S&P 500 Index. It had 40% of the fund in cash at the end of the quarter. In addition, you can […] |
Advantage Solutions simplifies international footprint as the company continues to refocus on its core business and accelerate growthIRVINE, Calif., Dec. 12, 2023 (GLOBE NEWSWIRE) -- Advantage Solutions Inc. (NASDAQ: ADV), a leading provider of sales and marketing services to consumer goods manufacturers and retailers, today announced a plan to streamline and restructure its international businesses in an effort to sharpen its focus on core markets and accelerate growth. The changes will reduce back-office complexities and expenses, simplify financial reporting, eliminate losses in certain Asian businesses and enable the comp |
Two Roads Advisors Successfully Represents Toy Brand WeCool and Skincare Brand QRx on Their ExitsLeading boutique investment bank Two Roads Advisors has represented two well-known consumer brands on their successful exits to buyers in November, selling slime and compounds maker WeCool Toys (Compound Kings) to Paladone, a portfolio company of private equity firm IVEST Consumer Partners and premium skincare brand QRx to Amazon aggregator Forum Brands. |
Advantage Solutions hires Brian McRoskey as Chief Growth OfficerBain & Company Senior Partner will bring a wealth of CPG experience and insights to Advantage’s clientsIRVINE, Calif., Nov. 30, 2023 (GLOBE NEWSWIRE) -- Advantage Solutions Inc. (NASDAQ: ADV), a leading provider of sales and marketing services to consumer goods manufacturers and retailers, today announced the appointment of Brian McRoskey as Chief Growth Officer, effective January 1, 2024. McRoskey will report directly to Dave Peacock, CEO of Advantage Solutions. “We are thrilled to welcome Bria |
Director James Kilts' Significant Insider Purchase in Advantage Solutions IncInsider buying can be an informative indicator for investors, as it may suggest that those with the most intimate knowledge of a company's operations believe in the stock's future performance. |
ADV Price Returns
| 1-mo | -4.24% |
| 3-mo | 10.60% |
| 6-mo | 66.12% |
| 1-year | 223.02% |
| 3-year | -68.84% |
| 5-year | N/A |
| YTD | 12.43% |
| 2023 | 74.04% |
| 2022 | -74.06% |
| 2021 | -39.10% |
| 2020 | N/A |
| 2019 | N/A |
Loading social stream, please wait...