
Adams Resources & Energy, Inc. (AE): Price and Financial Metrics
AE Price/Volume Stats
| Current price | $28.35 | 52-week high | $39.95 |
| Prev. close | $29.01 | 52-week low | $22.67 |
| Day low | $28.30 | Volume | 6,400 |
| Day high | $29.87 | Avg. volume | 9,459 |
| 50-day MA | $26.31 | Dividend yield | 3.27% |
| 200-day MA | $29.88 | Market Cap | 72.77M |
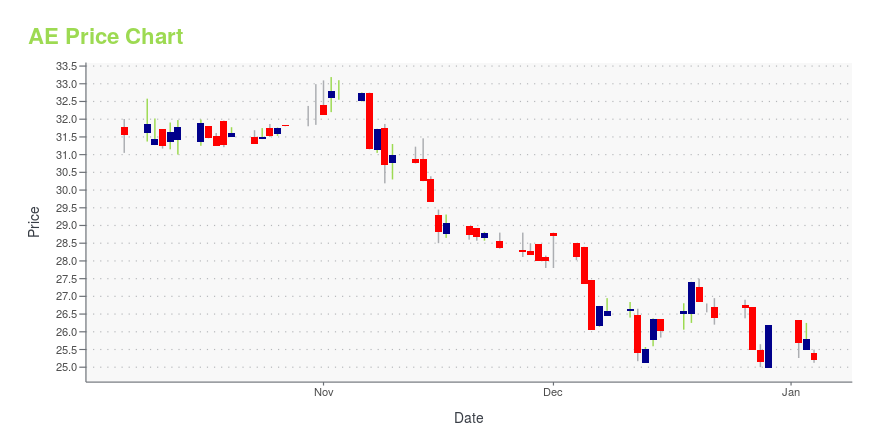
AE Stock Price Chart Interactive Chart >
Adams Resources & Energy, Inc. (AE) Company Bio
Adams Resources & Energy, Inc. engages in the business of crude oil marketing, tank truck transportation of liquid chemicals, and oil and gas exploration and production in the United States. The company was founded in 1947 and is based in Houston, Texas.
Latest AE News From Around the Web
Below are the latest news stories about ADAMS RESOURCES & ENERGY INC that investors may wish to consider to help them evaluate AE as an investment opportunity.
Adams Resources & Energy, Inc. (AMEX:AE) Q3 2023 Earnings Call TranscriptAdams Resources & Energy, Inc. (AMEX:AE) Q3 2023 Earnings Call Transcript November 9, 2023 Operator: Good morning, everyone. Welcome to the Adams Resources & Energy Third Quarter 2023 Financial Results Conference Call. All participants will be in a listen-only mode. [Operator Instructions] After today’s presentation there will be a question-and-answer session. [Operator Instruction] As a […] |
ADAMS RESOURCES & ENERGY, INC. TO PRESENT AND HOST 1x1 INVESTOR MEETINGS AT THE 15th ANNUAL SOUTHWEST IDEAS INVESTOR CONFERENCE ON NOVEMBER 15th & 16th IN DALLAS, TXAdams Resources & Energy, Inc. (NYSE AMERICAN: AE) ("Adams" or the "Company") today announced that Kevin Roycraft, Chief Executive Officer, President and Board Member of the Company, and Tracy Ohmart, Executive Vice President, Chief Financial Officer & Treasurer of the Company, will present at the Southwest IDEAS Investor Conference on Thursday November 16, 2023 at The Statler in Dallas, TX. Adams Resources and Energy's presentation is scheduled to begin at 10:50 AM CT. |
Adams Resources & Energy Inc (AE) Reports Mixed Q3 Results Amidst Market ChallengesNet Income Rises Sequentially as Company Navigates Economic Headwinds |
ADAMS RESOURCES & ENERGY, INC. ANNOUNCES THIRD QUARTER 2023 RESULTS AND DECLARES QUARTERLY DIVIDENDAdams Resources & Energy, Inc. (NYSE AMERICAN: AE) ("Adams" or the "Company"), a company engaged in marketing, transportation, logistics and repurposing of crude oil, refined products and dry bulk materials, today announced operational and financial results for the quarter ended September 30, 2023. The Company also declared a quarterly cash dividend of $0.24 per common share. |
11 Best Oil Refinery Stocks To BuyIn this piece, we will take a look at the 11 best oil refinery stocks to buy. If you want to skip our overview of the dynamics within the oil industry and recent developments, then take a look at the 5 Best Oil Refinery Stocks To Buy. The modern day oil industry is responsible for […] |
AE Price Returns
| 1-mo | 18.08% |
| 3-mo | 20.45% |
| 6-mo | -8.72% |
| 1-year | -25.22% |
| 3-year | 14.78% |
| 5-year | -9.67% |
| YTD | 9.27% |
| 2023 | -30.95% |
| 2022 | 43.97% |
| 2021 | 19.33% |
| 2020 | -34.33% |
| 2019 | 1.16% |
AE Dividends
| Ex-Dividend Date | Type | Payout Amount | Change | ||||||
|---|---|---|---|---|---|---|---|---|---|
| Loading, please wait... | |||||||||
Continue Researching AE
Here are a few links from around the web to help you further your research on Adams Resources & Energy Inc's stock as an investment opportunity:Adams Resources & Energy Inc (AE) Stock Price | Nasdaq
Adams Resources & Energy Inc (AE) Stock Quote, History and News - Yahoo Finance
Adams Resources & Energy Inc (AE) Stock Price and Basic Information | MarketWatch
Loading social stream, please wait...