Argan, Inc. (AGX): Price and Financial Metrics
GET POWR RATINGS... FREE!
AGX POWR Grades
- Sentiment is the dimension where AGX ranks best; there it ranks ahead of 88.74% of US stocks.
- The strongest trend for AGX is in Growth, which has been heading up over the past 177 days.
- AGX ranks lowest in Value; there it ranks in the 29th percentile.
AGX Stock Summary
- For AGX, its debt to operating expenses ratio is greater than that reported by just 0.44% of US equities we're observing.
- The volatility of ARGAN INC's share price is greater than that of just 13.43% US stocks with at least 200 days of trading history.
- Shareholder yield, a measure of how much is returned to shareholders via dividends and share repurchases, for AGX comes in at 18.15% -- higher than that of 89.79% of stocks in our set.
- Stocks with similar financial metrics, market capitalization, and price volatility to ARGAN INC are MEI, IPDN, ESQ, MLI, and CULL.
- Visit AGX's SEC page to see the company's official filings. To visit the company's web site, go to www.arganinc.com.
AGX Valuation Summary
- AGX's EV/EBIT ratio is 11.1; this is 28.85% lower than that of the median Industrials stock.
- AGX's price/earnings ratio has moved up 14.4 over the prior 243 months.
Below are key valuation metrics over time for AGX.
Stock | Date | P/S | P/B | P/E | EV/EBIT |
---|---|---|---|---|---|
AGX | 2023-03-17 | 1.2 | 2.0 | 24.8 | 11.1 |
AGX | 2023-03-16 | 1.2 | 2.0 | 25.5 | 11.5 |
AGX | 2023-03-15 | 1.2 | 2.0 | 25.2 | 11.3 |
AGX | 2023-03-14 | 1.2 | 2.0 | 25.7 | 11.6 |
AGX | 2023-03-13 | 1.2 | 2.0 | 25.4 | 11.4 |
AGX | 2023-03-10 | 1.2 | 2.1 | 26.2 | 11.9 |
AGX Growth Metrics
- The 3 year net cashflow from operations growth rate now stands at 67.34%.
- Its year over year cash and equivalents growth rate is now at -51.53%.
- The 5 year price growth rate now stands at -33.57%.

The table below shows AGX's growth in key financial areas (numbers in millions of US dollars).
Date | Revenue | Operating Cash Flow | Net Income to Common Stock |
---|---|---|---|
2022-09-30 | 461.832 | -86.272 | 21.68 |
2022-06-30 | 468.408 | -75.545 | 26.315 |
2022-03-31 | 483.306 | -28.661 | 34.963 |
2021-12-31 | 509.37 | 28.415 | 38.244 |
2021-09-30 | 501.035 | 73.819 | 45.58 |
2021-06-30 | 503.915 | 118.963 | 42.641 |
AGX's Quality Factors
The “Quality” component of the POWR Ratings focuses on 31 different factors of a companies fundamentals and operational strength. Here are some key insights as we drill into the specifics of these quality attributes.- AGX has a Quality Grade of A, ranking ahead of 98.38% of graded US stocks.
- AGX's asset turnover comes in at 0.817 -- ranking 43rd of 51 Construction stocks.
- ORN, BLD, and IESC are the stocks whose asset turnover ratios are most correlated with AGX.
The table below shows AGX's key quality metrics over time.
Period | Asset Turnover | Gross Margin | ROIC |
---|---|---|---|
2021-07-31 | 0.817 | 0.186 | -0.616 |
2021-04-30 | 0.771 | 0.178 | -0.588 |
2021-01-31 | 0.690 | 0.158 | -0.600 |
2020-10-31 | 0.636 | 0.132 | 0.293 |
2020-07-31 | 0.539 | 0.113 | -0.298 |
2020-04-30 | 0.527 | 0.073 | -0.242 |
AGX Price Target
For more insight on analysts targets of AGX, see our AGX price target page. And for a list of of all stocks sorted by upside potential based on analyst target price, see our Top Price Target page.
Average Price Target | $60.50 | Average Broker Recommendation | 1.5 (Moderate Buy) |
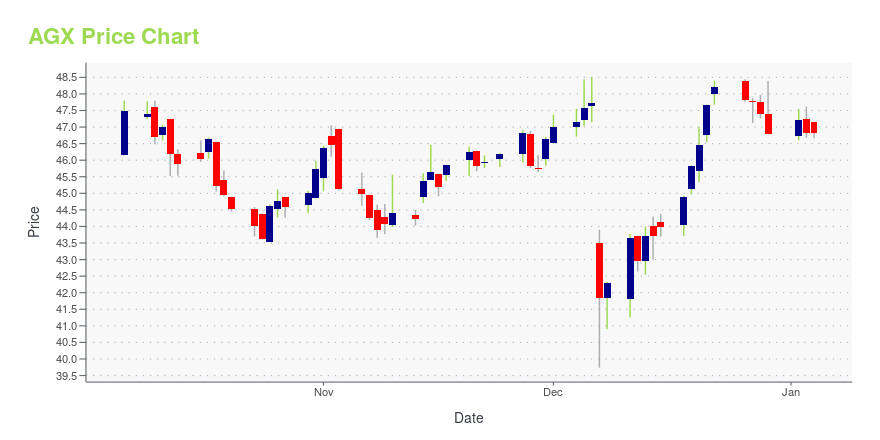
AGX Stock Price Chart Interactive Chart >
AGX Price/Volume Stats
Current price | $39.94 | 52-week high | $43.50 |
Prev. close | $39.75 | 52-week low | $31.26 |
Day low | $39.41 | Volume | 28,600 |
Day high | $40.08 | Avg. volume | 67,235 |
50-day MA | $39.56 | Dividend yield | 2.5% |
200-day MA | $36.59 | Market Cap | 542.23M |
Argan, Inc. (AGX) Company Bio
Argan Inc. provides a range of development, consulting, engineering, procurement, construction, commissioning, operations, and maintenance services to the power generation and renewable energy markets. The company operates through Power Industry Services and Telecommunications Infrastructure Services segment. The company was founded in 1961 and is based in Rockville, Maryland.
Latest AGX News From Around the Web
Below are the latest news stories about ARGAN INC that investors may wish to consider to help them evaluate AGX as an investment opportunity.
Argan (NYSE:AGX) shareholders have earned a 8.0% CAGR over the last three yearsBuying a low-cost index fund will get you the average market return. But across the board there are plenty of stocks... |
Argan (NYSE:AGX) Has Some Difficulty Using Its Capital EffectivelyWhat underlying fundamental trends can indicate that a company might be in decline? Businesses in decline often have... |
Argan, Inc. (NYSE:AGX) is favoured by institutional owners who hold 84% of the companyTo get a sense of who is truly in control of Argan, Inc. ( NYSE:AGX ), it is important to understand the ownership... |
Argan, Inc. (NYSE:AGX) Stock Is Going Strong But Fundamentals Look Uncertain: What Lies Ahead ?Argan (NYSE:AGX) has had a great run on the share market with its stock up by a significant 14% over the last three... |
Argan (NYSE:AGX) Is Due To Pay A Dividend Of $0.25Argan, Inc. ( NYSE:AGX ) has announced that it will pay a dividend of $0.25 per share on the 31st of January. Based on... |
AGX Price Returns
1-mo | 2.78% |
3-mo | 9.02% |
6-mo | 25.92% |
1-year | 1.86% |
3-year | 27.37% |
5-year | 9.67% |
YTD | 9.02% |
2022 | -2.01% |
2021 | -11.64% |
2020 | 19.15% |
2019 | 8.62% |
2018 | -14.32% |
AGX Dividends
Ex-Dividend Date | Type | Payout Amount | Change | ||||||
---|---|---|---|---|---|---|---|---|---|
Loading, please wait... |
Continue Researching AGX
Want to see what other sources are saying about Argan Inc's financials and stock price? Try the links below:Argan Inc (AGX) Stock Price | Nasdaq
Argan Inc (AGX) Stock Quote, History and News - Yahoo Finance
Argan Inc (AGX) Stock Price and Basic Information | MarketWatch
Loading social stream, please wait...