Apartment Investment and Management Company (AIV): Price and Financial Metrics
AIV Price/Volume Stats
Current price | $7.14 | 52-week high | $8.93 |
Prev. close | $7.13 | 52-week low | $5.63 |
Day low | $7.05 | Volume | 672,000 |
Day high | $7.18 | Avg. volume | 1,156,996 |
50-day MA | $6.50 | Dividend yield | N/A |
200-day MA | $7.58 | Market Cap | 1.04B |
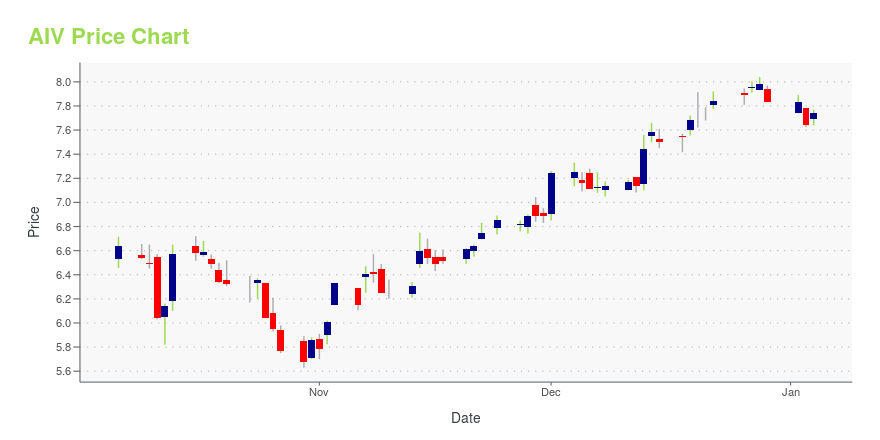
AIV Stock Price Chart Interactive Chart >
AIV POWR Grades
- Growth is the dimension where AIV ranks best; there it ranks ahead of 93.85% of US stocks.
- The strongest trend for AIV is in Quality, which has been heading down over the past 177 days.
- AIV ranks lowest in Value; there it ranks in the 10th percentile.
AIV Stock Summary
- Price to trailing twelve month operating cash flow for AIV is currently 56.95, higher than 94.28% of US stocks with positive operating cash flow.
- For AIV, its debt to operating expenses ratio is greater than that reported by 94.04% of US equities we're observing.
- In terms of twelve month growth in earnings before interest and taxes, APARTMENT INVESTMENT & MANAGEMENT CO is reporting a growth rate of -152.56%; that's higher than just 9.26% of US stocks.
- Stocks with similar financial metrics, market capitalization, and price volatility to APARTMENT INVESTMENT & MANAGEMENT CO are LPG, GATX, GTY, OLP, and RPT.
- Visit AIV's SEC page to see the company's official filings. To visit the company's web site, go to www.aimco.com.
AIV Valuation Summary
- AIV's EV/EBIT ratio is -10.5; this is 137.1% lower than that of the median Real Estate stock.
- AIV's EV/EBIT ratio has moved down 28.7 over the prior 243 months.
Below are key valuation metrics over time for AIV.
Stock | Date | P/S | P/B | P/E | EV/EBIT |
---|---|---|---|---|---|
AIV | 2023-11-15 | 5.3 | 1.9 | -4.4 | -10.5 |
AIV | 2023-11-14 | 5.4 | 1.9 | -4.5 | -10.5 |
AIV | 2023-11-13 | 5.1 | 1.8 | -4.3 | -10.3 |
AIV | 2023-11-10 | 5.1 | 1.8 | -4.3 | -10.3 |
AIV | 2023-11-09 | 5.1 | 1.8 | -4.2 | -10.3 |
AIV | 2023-11-08 | 5.2 | 1.8 | -4.3 | -10.4 |
AIV Growth Metrics
- Its 3 year revenue growth rate is now at -81.15%.
- The 2 year price growth rate now stands at -87.45%.
- Its year over year price growth rate is now at -14.07%.

The table below shows AIV's growth in key financial areas (numbers in millions of US dollars).
Date | Revenue | Operating Cash Flow | Net Income to Common Stock |
---|---|---|---|
2022-09-30 | 195.095 | 218.753 | 275.4 |
2022-06-30 | 190.305 | 21.498 | 240.912 |
2022-03-31 | 180.026 | 16.773 | -17.915 |
2021-12-31 | 169.836 | 12.586 | -5.91 |
2021-09-30 | -384.249 | -195.945 | -30.378 |
2021-06-30 | -211.687 | -120.045 | -50.408 |
AIV's Quality Factors
The “Quality” component of the POWR Ratings focuses on 31 different factors of a companies fundamentals and operational strength. Here are some key insights as we drill into the specifics of these quality attributes.- AIV has a Quality Grade of C, ranking ahead of 35.21% of graded US stocks.
- AIV's asset turnover comes in at -0.063 -- ranking 444th of 444 Trading stocks.
- GROW, PTMN, and NAVI are the stocks whose asset turnover ratios are most correlated with AIV.
The table below shows AIV's key quality metrics over time.
Period | Asset Turnover | Gross Margin | ROIC |
---|---|---|---|
2021-06-30 | -0.063 | 0.731 | -0.019 |
2021-03-31 | -0.007 | 1.054 | -0.001 |
2020-12-31 | 0.026 | 0.594 | 0.001 |
2020-09-30 | 0.127 | 0.653 | 0.029 |
2020-06-30 | 0.131 | 0.659 | 0.031 |
2020-03-31 | 0.136 | 0.660 | 0.034 |
AIV Price Target
For more insight on analysts targets of AIV, see our AIV price target page. And for a list of of all stocks sorted by upside potential based on analyst target price, see our Top Price Target page.
Average Price Target | $37.12 | Average Broker Recommendation | 1 (Strong Buy) |
Apartment Investment and Management Company (AIV) Company Bio
Apartment Investment and Management Company primarily invests in apartment properties. The company was founded in 1994 and is based in Denver, Colorado.
Latest AIV News From Around the Web
Below are the latest news stories about APARTMENT INVESTMENT & MANAGEMENT CO that investors may wish to consider to help them evaluate AIV as an investment opportunity.
Apartment Investment Management: Q3 Earnings SnapshotOn a per-share basis, the Denver-based company said it had a loss of 2 cents. The real estate investment trust posted revenue of $47.7 million in the period. Apartment Investment Management expects a full-year loss of 21 cents to 11 cents per share. |
Aimco Reports Third Quarter Results, Updates 2023 Guidance, and Provides Highlights on Recent and Planned ActivitiesDENVER, November 06, 2023--Apartment Investment and Management Company ("Aimco") (NYSE: AIV) announced today third quarter results for 2023, updated guidance, and provided highlights on recent and planned activities. |
Aimco Announces Third Quarter 2023 Earnings DateDENVER, October 25, 2023--Apartment Investment and Management Company ("Aimco") (NYSE: AIV) announced today that it plans to report 2023 third quarter results on Monday, November 6, 2023, after the market closes. The Company’s earnings release will be available in the Investor Relations section of its website at investors.aimco.com. |
AIR Communities Helps Raise $529,000 For Military and Educational Causes in 20th Annual Golf ClassicDENVER, September 20, 2023--AIR Communities along with Aimco and many longstanding business partners secured $529,000 for beneficiaries of the 20th annual Charity Golf Classic. |
Canada's AIMCo to open its first Asia office in SingaporeCanadian pension fund manager Alberta Investment Management Corporation (AIMCo) said on Tuesday it was expanding into Asia and opening its first regional office in Singapore. The fund manager, which manages $158 billion in assets, invests globally on behalf of 17 pension, endowment and government funds in the Canadian province of Alberta. Kevin Bong, a former managing director at Singaporean sovereign wealth fund GIC, will head the Asia Pacific office, the fund manager said. |
AIV Price Returns
1-mo | 14.24% |
3-mo | -3.77% |
6-mo | -16.00% |
1-year | -10.97% |
3-year | 61.96% |
5-year | 64.85% |
YTD | 0.28% |
2022 | -7.77% |
2021 | 46.21% |
2020 | 3.97% |
2019 | 25.62% |
2018 | 4.14% |
Continue Researching AIV
Want to do more research on Apartment Investment & Management Co's stock and its price? Try the links below:Apartment Investment & Management Co (AIV) Stock Price | Nasdaq
Apartment Investment & Management Co (AIV) Stock Quote, History and News - Yahoo Finance
Apartment Investment & Management Co (AIV) Stock Price and Basic Information | MarketWatch
Loading social stream, please wait...