Anika Therapeutics Inc. (ANIK): Price and Financial Metrics
GET POWR RATINGS... FREE!
ANIK POWR Grades
- ANIK scores best on the Value dimension, with a Value rank ahead of 93.74% of US stocks.
- The strongest trend for ANIK is in Value, which has been heading up over the past 179 days.
- ANIK ranks lowest in Sentiment; there it ranks in the 0th percentile.
ANIK Stock Summary
- ANIK's current price/earnings ratio is 91.3, which is higher than 92.37% of US stocks with positive earnings.
- Price to trailing twelve month operating cash flow for ANIK is currently 44.95, higher than 88.22% of US stocks with positive operating cash flow.
- ANIK's equity multiplier -- a measure of assets relative to shareholders'equity -- is greater than that of only 15.07% of US stocks.
- Stocks with similar financial metrics, market capitalization, and price volatility to Anika Therapeutics Inc are FLDM, PRLB, BNGO, BIGC, and RCEL.
- ANIK's SEC filings can be seen here. And to visit Anika Therapeutics Inc's official web site, go to www.anikatherapeutics.com.
ANIK Valuation Summary
- In comparison to the median Healthcare stock, ANIK's price/sales ratio is 60.35% lower, now standing at 4.5.
- Over the past 243 months, ANIK's EV/EBIT ratio has gone down 34.5.
- ANIK's price/sales ratio has moved up 3.9 over the prior 243 months.
Below are key valuation metrics over time for ANIK.
Stock | Date | P/S | P/B | P/E | EV/EBIT |
---|---|---|---|---|---|
ANIK | 2021-08-31 | 4.5 | 2.2 | -49.0 | -34.8 |
ANIK | 2021-08-30 | 4.5 | 2.2 | -48.8 | -34.7 |
ANIK | 2021-08-27 | 4.4 | 2.1 | -47.9 | -33.9 |
ANIK | 2021-08-26 | 4.3 | 2.1 | -46.8 | -33.1 |
ANIK | 2021-08-25 | 4.4 | 2.1 | -47.3 | -33.4 |
ANIK | 2021-08-24 | 4.4 | 2.1 | -47.8 | -33.9 |
ANIK Growth Metrics
- Its 3 year price growth rate is now at -7.96%.
- Its 4 year revenue growth rate is now at 25.58%.
- Its 5 year revenue growth rate is now at 25.58%.

The table below shows ANIK's growth in key financial areas (numbers in millions of US dollars).
Date | Revenue | Operating Cash Flow | Net Income to Common Stock |
---|---|---|---|
2021-12-31 | 147.794 | 8.397 | 4.134 |
2021-09-30 | 144.661 | 6.512 | -5.729 |
2021-06-30 | 136.819 | 10.315 | -12.698 |
2021-03-31 | 129.352 | 9.589 | -26.937 |
2020-12-31 | 130.457 | 13.065 | -23.982 |
2020-12-31 | 130.457 | 13.065 | -23.982 |
ANIK's Quality Factors
The “Quality” component of the POWR Ratings focuses on 31 different factors of a companies fundamentals and operational strength. Here are some key insights as we drill into the specifics of these quality attributes.- ANIK has a Quality Grade of B, ranking ahead of 75.55% of graded US stocks.
- ANIK's asset turnover comes in at 0.363 -- ranking 122nd of 186 Medical Equipment stocks.
- SYK, EYE, and ISRG are the stocks whose asset turnover ratios are most correlated with ANIK.
The table below shows ANIK's key quality metrics over time.
Period | Asset Turnover | Gross Margin | ROIC |
---|---|---|---|
2021-06-30 | 0.363 | 0.555 | -0.097 |
2021-03-31 | 0.326 | 0.532 | -0.187 |
2020-12-31 | 0.322 | 0.529 | -0.144 |
2020-12-31 | 0.322 | 0.529 | -0.144 |
2020-09-30 | 0.322 | 0.576 | -0.027 |
2020-06-30 | 0.337 | 0.636 | 0.076 |
ANIK Price Target
For more insight on analysts targets of ANIK, see our ANIK price target page. And for a list of of all stocks sorted by upside potential based on analyst target price, see our Top Price Target page.
Average Price Target | $49.67 | Average Broker Recommendation | 1.33 (Strong Buy) |
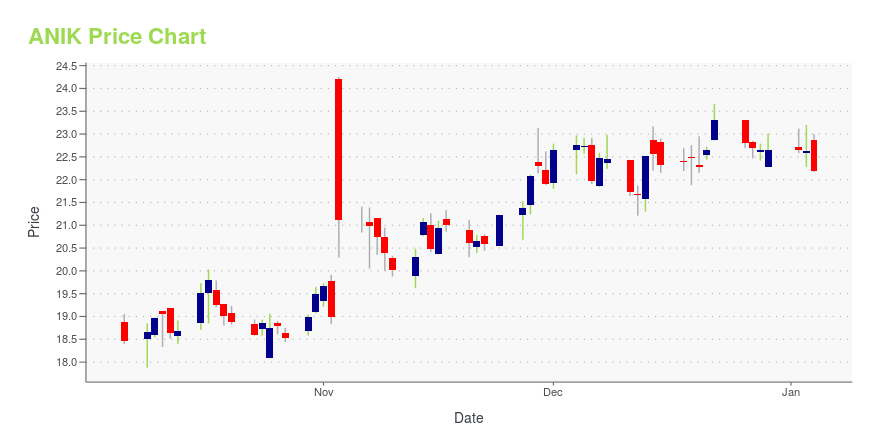
ANIK Stock Price Chart Interactive Chart >
ANIK Price/Volume Stats
Current price | $20.98 | 52-week high | $48.37 |
Prev. close | $21.89 | 52-week low | $19.95 |
Day low | $20.64 | Volume | 83,300 |
Day high | $22.31 | Avg. volume | 90,285 |
50-day MA | $23.69 | Dividend yield | N/A |
200-day MA | $34.20 | Market Cap | 305.13M |
Anika Therapeutics Inc. (ANIK) Company Bio
Anika Therapeutics develops, manufactures, and commercializes therapeutic products for tissue protection, healing, and repair. The company was founded in 1983 and is based in Bedford, Massachusetts.
Latest ANIK News From Around the Web
Below are the latest news stories about Anika Therapeutics Inc that investors may wish to consider to help them evaluate ANIK as an investment opportunity.
Alector (ALEC) Reports Q4 Loss, Lags Revenue EstimatesAlector (ALEC) delivered earnings and revenue surprises of -423.08% and 81.43%, respectively, for the quarter ended December 2021. Do the numbers hold clues to what lies ahead for the stock? |
Great news for Anika Therapeutics, Inc. (NASDAQ:ANIK): Insiders acquired stock in large numbers last yearIt is usually uneventful when a single insider buys stock. However, When quite a few insiders buy shares, as it... |
Anika to Issue Fourth Quarter and Year-End 2021 Financial Results on Tuesday, March 8, 2022BEDFORD, Mass., Feb. 08, 2022 (GLOBE NEWSWIRE) -- Anika Therapeutics, Inc. (NASDAQ: ANIK), a global joint preservation company in early intervention orthopedics, today announced that the Company plans to issue its fourth quarter and year-end 2021 financial results after the close of the market on Tuesday, March 8, 2022 and hold its investor conference call on the same day, at 5:00 p.m. ET to discuss its financial results and business highlights. |
Facial Rejuvenation Market to See Booming Growth 2021-2028 | Merz Pharma, Anika Therapeutics, Inc., LumenisThe Facial Rejuvenation market report presents the global Facial Rejuvenation sales and revenue by companies, regions, type and application and forecast to 2026. This report also studies the global market status, competition landscape, market share, growth rate, future trends, market |
Anika Reports Inducement Grants Under Nasdaq Listing Rule 5635(c)(4)BEDFORD, Mass., Dec. 10, 2021 (GLOBE NEWSWIRE) -- Anika Therapeutics, Inc. (NASDAQ: ANIK), a global joint preservation company in early intervention orthopedics, today announced that on December 1, 2021, Anika granted non-statutory stock options covering an aggregate of 1,069 shares of common stock (the Options) and restricted stock units (the RSUs) covering an aggregate of 468 shares of common stock to 1 newly hired non-executive employee. Each grant was made pursuant to the Anika Therapeutics, Inc. 2021 Inducement Plan, was approved by the compensation committee of the board of directors pursuant to a delegation of authority by the board of directors, and, in accordance with Nasdaq Listing Rule 5635(c)(4), was made as a material inducement to the grantees acceptance of employment with... |
ANIK Price Returns
1-mo | -7.17% |
3-mo | -31.10% |
6-mo | -47.29% |
1-year | -52.38% |
3-year | -44.01% |
5-year | -55.18% |
YTD | -41.45% |
2021 | -20.84% |
2020 | -12.71% |
2019 | 54.27% |
2018 | -37.66% |
2017 | 10.11% |
Continue Researching ANIK
Here are a few links from around the web to help you further your research on Anika Therapeutics Inc's stock as an investment opportunity:Anika Therapeutics Inc (ANIK) Stock Price | Nasdaq
Anika Therapeutics Inc (ANIK) Stock Quote, History and News - Yahoo Finance
Anika Therapeutics Inc (ANIK) Stock Price and Basic Information | MarketWatch
Loading social stream, please wait...