Best Buy Co. Inc. (BBY): Price and Financial Metrics

Best Buy Co. Inc. (BBY): $74.78

1.36 (+1.85%)

POWR Rating

Component Grades

Momentum

D

Stability

D

Sentiment

Quality

B

Add BBY to Watchlist
Sign Up

Industry: Specialty Retailers

Industry

D

Ranked

#19 of 44

in industry

BBY Price/Volume Stats

Current price $74.78 52-week high $93.32
Prev. close $73.42 52-week low $62.30
Day low $73.19 Volume 216,994
Day high $74.80 Avg. volume 2,368,665
50-day MA $68.28 Dividend yield 5.19%
200-day MA $74.71 Market Cap 16.27B

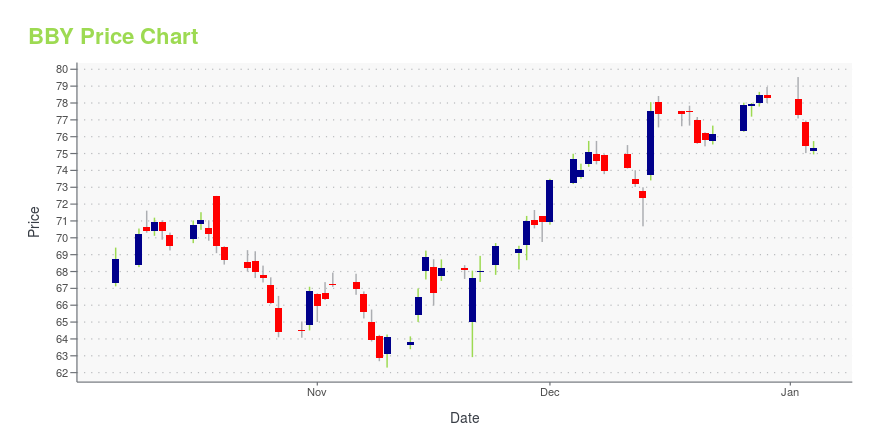
BBY Stock Price Chart Interactive Chart >

BBY POWR Grades

  • Quality is the dimension where BBY ranks best; there it ranks ahead of 82.75% of US stocks.
  • BBY's strongest trending metric is Growth; it's been moving up over the last 177 days.
  • BBY's current lowest rank is in the Momentum metric (where it is better than 7.13% of US stocks).

BBY Stock Summary

  • BEST BUY CO INC's capital turnover -- a measure of revenue relative to shareholder's equity -- is better than 97.77% of US listed stocks.
  • BBY's went public 37.89 years ago, making it older than 93.05% of listed US stocks we're tracking.
  • With a price/sales ratio of 0.31, BEST BUY CO INC has a higher such ratio than just 12.29% of stocks in our set.
  • Stocks that are quantitatively similar to BBY, based on their financial statements, market capitalization, and price volatility, are CHRW, BJ, WBA, DKS, and K.
  • BBY's SEC filings can be seen here. And to visit BEST BUY CO INC's official web site, go to www.bestbuy.com.

BBY Valuation Summary

  • In comparison to the median Consumer Cyclical stock, BBY's price/sales ratio is 57.14% lower, now standing at 0.3.
  • Over the past 243 months, BBY's price/sales ratio has gone down 0.6.

Below are key valuation metrics over time for BBY.

Stock Date P/S P/B P/E EV/EBIT
BBY 2023-10-20 0.3 5.3 11.6 10.5
BBY 2023-10-19 0.3 5.3 11.7 10.6
BBY 2023-10-18 0.3 5.4 11.8 10.7
BBY 2023-10-17 0.3 5.5 12.0 10.8
BBY 2023-10-16 0.3 5.4 11.9 10.7
BBY 2023-10-13 0.3 5.3 11.7 10.6

BBY Growth Metrics

    Its 5 year price growth rate is now at 32.86%.
  • The 4 year revenue growth rate now stands at 9.04%.
  • Its year over year net cashflow from operations growth rate is now at -58.07%.
BBY's revenue has moved up $4.29e+09 over the prior 33 months.

The table below shows BBY's growth in key financial areas (numbers in millions of US dollars).

Date Revenue Operating Cash Flow Net Income to Common Stock
2022-09-30 47,928 2,083 1,550
2022-06-30 49,251 1,679 1,772
2022-03-31 50,771 1,763 2,200
2021-12-31 51,761 3,252 2,454
2021-09-30 52,333 2,081 2,644
2021-06-30 52,276 2,003 2,536

BBY's Quality Factors

The “Quality” component of the POWR Ratings focuses on 31 different factors of a companies fundamentals and operational strength. Here are some key insights as we drill into the specifics of these quality attributes.
  • BBY has a Quality Grade of B, ranking ahead of 90.98% of graded US stocks.
  • BBY's asset turnover comes in at 2.731 -- ranking 16th of 165 Retail stocks.
  • DBI, TJX, and BURL are the stocks whose asset turnover ratios are most correlated with BBY.

The table below shows BBY's key quality metrics over time.

Period Asset Turnover Gross Margin ROIC
2021-07-31 2.731 0.227 0.477
2021-05-01 2.671 0.225 0.474
2021-01-30 2.580 0.224 0.382
2020-10-31 2.608 0.226 0.341
2020-08-01 2.651 0.226 0.294
2020-05-02 2.730 0.229 0.229

BBY Price Target

For more insight on analysts targets of BBY, see our BBY price target page. And for a list of of all stocks sorted by upside potential based on analyst target price, see our Top Price Target page.

Average Price Target $130.12 Average Broker Recommendation 1.77 (Moderate Buy)

Best Buy Co. Inc. (BBY) Company Bio


Best Buy is an American multinational consumer electronics retailer headquartered in Richfield, Minnesota. Originally founded by Richard M. Schulze and James Wheeler in 1966 as an audio specialty store called Sound of Music, it was rebranded under its current name with an emphasis on consumer electronics in 1983. (Source:Wikipedia)


BBY Latest News Stream


Event/Time News Detail
Loading, please wait...

BBY Latest Social Stream


Loading social stream, please wait...

View Full BBY Social Stream

Latest BBY News From Around the Web

Below are the latest news stories about BEST BUY CO INC that investors may wish to consider to help them evaluate BBY as an investment opportunity.

Retailers are ready to kick off Black Friday just as shoppers pull back on spending

Retailers are growing concerned that a spending slowdown could temper sales on the day after Thanksgiving and throughout the holidays.

Yahoo | November 23, 2023

Corporate America hasn't talked this little about recession in two years

Corporate America is talking less about a recession, a development that is in line with economist forecasts that have revised out the likelihood of recession in the year ahead.

Yahoo | November 23, 2023

Earnings: Nvidia, Zoom, Abercrombie among winners, losers

Major companies, including Zoom (ZM), Best Buy (BBY), Dick's Sporting Goods (DKS), Nordstrom (JWN), Abercrombie & Fitch (ANF), and most notably, Nvidia (NVDA), reported third-quarter earnings on Tuesday. Yahoo Finance spoke to experts across the industry to discuss everything investors need to know, including the winners and losers from this week's results. Nvidia (00:00:25) Nvidia reported adjusted earnings of $4.02 per share, well above the expected $3.36. Moor Insights and Strategy CEO and Chief Analyst Patrick Moorhead said, "They can name their price. And it's in a supply constrained environment. I think Nvidia could have done even better." Zoom (00:00:48) Zoom reported adjusted earnings of $1.29 per share compared to estimates of $1.10, and raised its 2024 outlook. "In our online ...

Yahoo | November 22, 2023

Best Buy Co., Inc. (NYSE:BBY) Q3 2024 Earnings Call Transcript

Best Buy Co., Inc. (NYSE:BBY) Q3 2024 Earnings Call Transcript November 21, 2023 Best Buy Co., Inc. beats earnings expectations. Reported EPS is $1.29, expectations were $1.19. Operator: Ladies and gentlemen, thank you for standing by. Welcome to the Best Buy’s Third Quarter Fiscal 2024 Earnings Conference Call. At this time, all participants are in […]

Yahoo | November 22, 2023

Early holiday shopping trends show deal-focused consumers this season

Consumers are being mindful of how they're shopping this holiday season.

Yahoo | November 22, 2023

Read More 'BBY' Stories Here

BBY Price Returns

1-mo 11.30%
3-mo 2.42%
6-mo 1.29%
1-year -9.45%
3-year -20.79%
5-year N/A
YTD -3.29%
2022 -17.49%
2021 4.44%
2020 16.71%
2019 70.50%
2018 -20.63%

BBY Dividends

Ex-Dividend Date Type Payout Amount Change
Loading, please wait...
View Full BBY Dividend History

Get Free Updates

Join thousands of investors who get the latest news, insights and top rated picks from StockNews.com!