
Brera Holdings PLC (BREA): Price and Financial Metrics
BREA Price/Volume Stats
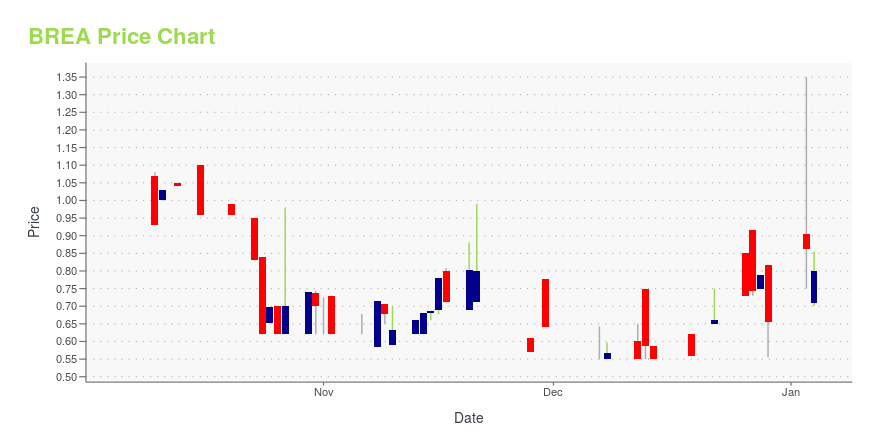
| Current price | $1.29 | 52-week high | $3.26 |
| Prev. close | $1.28 | 52-week low | $0.53 |
| Day low | $1.24 | Volume | 52,300 |
| Day high | $1.33 | Avg. volume | 1,465,222 |
| 50-day MA | $1.33 | Dividend yield | N/A |
| 200-day MA | $1.31 | Market Cap | 14.72M |
BREA Stock Price Chart Interactive Chart >
Latest BREA News From Around the Web
Below are the latest news stories about BRERA HOLDINGS PLC that investors may wish to consider to help them evaluate BREA as an investment opportunity.
Brera Tchumene promoted to Moçambola, football’s First Division in MozambiqueBrera’s Multi-Club Ownership model now spans three top-tier teams on three continents Brera Tchumene's players celebrating their Promotion to the Top Division of Mozambique Football. Brera Tchumene's players celebrating their Promotion to the Top Division of Mozambique Football. NEW YORK, MILAN, MAPUTO, Nov. 27, 2023 (GLOBE NEWSWIRE) -- Brera Holdings PLC ("Brera Holdings" or the "Company" or “Brera,” Nasdaq: BREA) announces that its Mozambican Club Brera Tchumene has been promoted to the Moçamb |
Brera Holdings Announces the Launch of its FENIX Trophy 2023-24 Edition First Kick-Off on October 24th Features Prague Raptors Hosting Venus BucharestThe third edition of Brera’s tournament BBC Sport calls “Champions League for Amateurs” includes a documentary film of the first three games in Prague, Krakow and Beveren Past Fenix Trophy Winners Past Fenix Trophy Winners - Photo by Mike Bayly MILAN, Oct. 24, 2023 (GLOBE NEWSWIRE) -- Brera Holdings PLC ("Brera Holdings", “Brera” or the "Company") (Nasdaq: BREA) announces the third edition of its FENIX Trophy tournament– the European championship called “Champions League for amateurs” by BBC Spo |
Brera Holdings Announces Control Transaction and Re-Branding Of Mongolian Premier League Team As Brera Ilch FCBringing the Brera brand to Asia, adding a third continent to its successful football clubs in Europe and AfricaDUBLIN and MILAN, Oct. 03, 2023 (GLOBE NEWSWIRE) -- Brera Holdings PLC ("Brera Holdings", "Brera" or the "Company") (Nasdaq: BREA) announced that its wholly-owned subsidiary Brera Milano S.r.l. (“Brera Milano”) has assumed control of Mongolia’s Bayanzurkh Sporting Ilch FC (“Bayanzurkh FC”), and is moving forward with the rebranding as “Brera Ilch FC”. Bayanzurkh FC, located in Mongolia |
Brera Tchumene FC is Provincial Champion in Mozambique; Advances to First Division Promotion TournamentThe Brera club won the Provincial II Divisão Championship for Maputo, and the Promotion Pool matches begin next weekend Brera Tchumene Divisional Champions 2023 Mozambique Brera Tchumene Divisional Champions 2023 Mozambique DUBLIN and MILAN, Sept. 26, 2023 (GLOBE NEWSWIRE) -- Brera Holdings PLC ("Brera Holdings", "Brera" or the "Company") (Nasdaq: BREA) announced that its Mozambique football team, Brera Tchumene FC, won the Province of Maputo title, ending a sensational run in the Provincial II |
Nine Brera Pro Players Selected to Represent Their National Youth Teams of North Macedonia and MozambiqueBrera Brand to Gain International Spotlight in upcoming matches against Sweden, the Netherlands and Eswatini Brera Tchumene in action Brera Tchumene in action DUBLIN and MILAN, MAPUTO and STRUMICA, Sept. 06, 2023 (GLOBE NEWSWIRE) -- Brera Holdings PLC ("Brera Holdings" or the "Company", Nasdaq: BREA) announced that nine professional Brera players have been selected to represent their national youth teams. Of these, two hail from Brera Strumica in North Macedonia’s First Division League, while th |
BREA Price Returns
| 1-mo | -20.37% |
| 3-mo | -0.02% |
| 6-mo | 55.42% |
| 1-year | -57.00% |
| 3-year | N/A |
| 5-year | N/A |
| YTD | 96.77% |
| 2023 | N/A |
| 2022 | N/A |
| 2021 | N/A |
| 2020 | N/A |
| 2019 | N/A |
Loading social stream, please wait...