CASI Pharmaceuticals, Inc. (CASI): Price and Financial Metrics
CASI Price/Volume Stats
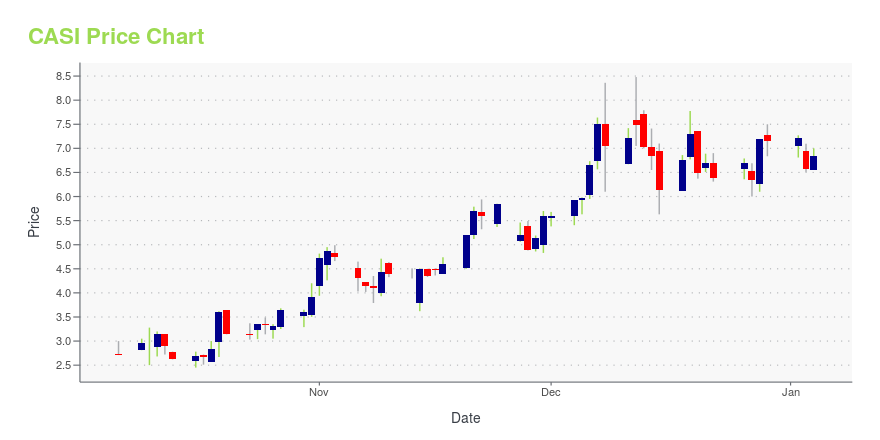
Current price | $2.82 | 52-week high | $4.90 |
Prev. close | $2.78 | 52-week low | $1.45 |
Day low | $2.75 | Volume | 58,000 |
Day high | $2.98 | Avg. volume | 33,021 |
50-day MA | $2.61 | Dividend yield | N/A |
200-day MA | $2.41 | Market Cap | 37.57M |
CASI Stock Price Chart Interactive Chart >
CASI Stock Summary
- CASI PHARMACEUTICALS INC's market capitalization of $34,586,096 is ahead of only 11.72% of US-listed equities.
- For CASI, its debt to operating expenses ratio is greater than that reported by only 0.39% of US equities we're observing.
- With a year-over-year growth in debt of -100%, CASI PHARMACEUTICALS INC's debt growth rate surpasses just 0% of about US stocks.
- If you're looking for stocks that are quantitatively similar to CASI PHARMACEUTICALS INC, a group of peers worth examining would be UPST, BIGC, VERI, TWOU, and LVOX.
- Visit CASI's SEC page to see the company's official filings. To visit the company's web site, go to www.casipharmaceuticals.com.
CASI Valuation Summary
- CASI's price/sales ratio is 0.8; this is 60% lower than that of the median Healthcare stock.
- Over the past 243 months, CASI's price/sales ratio has gone down 55.2.
Below are key valuation metrics over time for CASI.
Stock | Date | P/S | P/B | P/E | EV/EBIT |
---|---|---|---|---|---|
CASI | 2023-05-01 | 0.8 | 0.8 | -0.9 | 0.3 |
CASI | 2023-04-28 | 0.9 | 0.9 | -0.9 | 0.2 |
CASI | 2023-04-27 | 0.9 | 0.9 | -1.0 | 0.2 |
CASI | 2023-04-26 | 0.9 | 0.9 | -0.9 | 0.2 |
CASI | 2023-04-25 | 1.1 | 0.7 | -1.5 | -0.5 |
CASI | 2023-04-24 | 1.1 | 0.7 | -1.5 | -0.6 |
CASI Growth Metrics
- The 2 year price growth rate now stands at -82.06%.
- The 3 year price growth rate now stands at -90.19%.
- Its 4 year price growth rate is now at 68.93%.

The table below shows CASI's growth in key financial areas (numbers in millions of US dollars).
Date | Revenue | Operating Cash Flow | Net Income to Common Stock |
---|---|---|---|
2022-09-30 | 37.006 | -27.886 | -27.078 |
2022-06-30 | 34.905 | -25.222 | -32.101 |
2022-03-31 | 33.494 | -23.079 | -31.367 |
2021-12-31 | 30.168 | -26.842 | -36.654 |
2021-09-30 | 25.832 | -27.233 | -45.252 |
2021-06-30 | 21.962 | -30.203 | -51.981 |
CASI's Quality Factors
The “Quality” component of the POWR Ratings focuses on 31 different factors of a companies fundamentals and operational strength. Here are some key insights as we drill into the specifics of these quality attributes.- CASI has a Quality Grade of F, ranking ahead of 3.6% of graded US stocks.
- CASI's asset turnover comes in at 0.158 -- ranking 218th of 682 Pharmaceutical Products stocks.
- DRNA, RARE, and ALNY are the stocks whose asset turnover ratios are most correlated with CASI.
The table below shows CASI's key quality metrics over time.
Period | Asset Turnover | Gross Margin | ROIC |
---|---|---|---|
2021-06-30 | 0.158 | 0.585 | -0.969 |
2021-03-31 | 0.139 | 0.505 | -1.192 |
2020-12-31 | 0.134 | 0.372 | -1.351 |
2020-09-30 | 0.109 | 0.242 | -1.615 |
2020-06-30 | 0.101 | 0.053 | -1.638 |
2020-03-31 | 0.070 | 0.052 | -2.024 |
CASI Price Target
For more insight on analysts targets of CASI, see our CASI price target page. And for a list of of all stocks sorted by upside potential based on analyst target price, see our Top Price Target page.
Average Price Target | $4.45 | Average Broker Recommendation | 1.25 (Strong Buy) |
CASI Pharmaceuticals, Inc. (CASI) Company Bio
CASI Pharmaceuticals, Inc., a late-stage biopharmaceutical company, acquires, develops, and commercializes therapeutics addressing cancer and other unmet medical needs in China. The company was founded in 1991 and is based in Rockville, Maryland.
Latest CASI News From Around the Web
Below are the latest news stories about CASI PHARMACEUTICALS INC that investors may wish to consider to help them evaluate CASI as an investment opportunity.
CASI PHARMACEUTICALS ANNOUNCES FIRST QUARTER 2023 FINANCIAL RESULTSCASI Pharmaceuticals, Inc. (Nasdaq: CASI), a Cayman Islands incorporated biopharmaceutical company focused on developing and commercializing innovative therapeutics and pharmaceutical products, today reported financial results for the three months ended March 31, 2023. |
CASI Pharmaceuticals Files Annual Report on Form 20-F for Fiscal Year 2022CASI Pharmaceuticals, Inc. (NASDAQ: CASI) ("CASI" or the "Company"), a biopharmaceutical company focused on developing and commercializing innovative therapeutics and pharmaceutical products, today announced that it filed its annual report on Form 20-F for the fiscal year ended December 31, 2022, with the U.S. Securities and Exchange Commission ("SEC") on April 26, 2023. The annual report can be accessed on the Company's investor relations website at https://www.casipharmaceuticals.com/investor- |
CASI PHARMACEUTICALS ANNOUNCES FOURTH QUARTER AND FULL-YEAR 2022 FINANCIAL RESULTSCASI Pharmaceuticals, Inc. (Nasdaq: CASI), a Cayman incorporated biopharmaceutical company focused on developing and commercializing innovative therapeutics and pharmaceutical products, today reported financial results for the year ended December 31, 2022, and provided an update on key highlights for 2022. |
Improved Revenues Required Before CASI Pharmaceuticals, Inc. (NASDAQ:CASI) Stock's 114% Jump Looks JustifiedCASI Pharmaceuticals, Inc. ( NASDAQ:CASI ) shareholders would be excited to see that the share price has had a great... |
CASI PHARMACEUTICALS COMPLETES REDOMICILIATION MERGERCASI Pharmaceuticals, Inc. (NASDAQ: CASI) ("CASI" or the "Company"), a biopharmaceutical company focused on developing and commercializing innovative therapeutics and pharmaceutical products, today announced that the redomiciliation merger to redomicile the Company as a Cayman Islands company (the "Redomiciliation Merger") has been completed. |
CASI Price Returns
1-mo | 4.83% |
3-mo | 46.88% |
6-mo | 44.62% |
1-year | -18.09% |
3-year | -89.32% |
5-year | -95.64% |
YTD | 57.54% |
2022 | -77.63% |
2021 | -72.88% |
2020 | -4.53% |
2019 | -23.13% |
2018 | 23.69% |
Loading social stream, please wait...