Century Aluminum Company (CENX): Price and Financial Metrics
GET POWR RATINGS... FREE!
CENX POWR Grades
- CENX scores best on the Momentum dimension, with a Momentum rank ahead of 95.53% of US stocks.
- The strongest trend for CENX is in Value, which has been heading down over the past 179 days.
- CENX ranks lowest in Value; there it ranks in the 10th percentile.
CENX Stock Summary
- The capital turnover (annual revenue relative to shareholder's equity) for CENX is 5.26 -- better than 92.77% of US stocks.
- For CENX, its debt to operating expenses ratio is greater than that reported by 88.38% of US equities we're observing.
- The volatility of Century Aluminum Co's share price is greater than that of 84.08% US stocks with at least 200 days of trading history.
- Stocks that are quantitatively similar to CENX, based on their financial statements, market capitalization, and price volatility, are ATI, CPAC, SBS, BRFS, and ESEA.
- CENX's SEC filings can be seen here. And to visit Century Aluminum Co's official web site, go to centuryaluminum.com.
CENX Valuation Summary
- In comparison to the median Basic Materials stock, CENX's EV/EBIT ratio is 135.53% lower, now standing at -5.4.
- CENX's price/earnings ratio has moved down 22 over the prior 243 months.
- Over the past 243 months, CENX's price/earnings ratio has gone down 22.
Below are key valuation metrics over time for CENX.
Stock | Date | P/S | P/B | P/E | EV/EBIT |
---|---|---|---|---|---|
CENX | 2021-09-03 | 0.7 | 3.1 | -4.3 | -5.4 |
CENX | 2021-09-02 | 0.6 | 3.1 | -4.2 | -5.4 |
CENX | 2021-09-01 | 0.6 | 3.0 | -4.2 | -5.3 |
CENX | 2021-08-31 | 0.7 | 3.1 | -4.3 | -5.5 |
CENX | 2021-08-30 | 0.6 | 3.0 | -4.2 | -5.3 |
CENX | 2021-08-27 | 0.6 | 3.0 | -4.2 | -5.3 |
CENX Growth Metrics
- The 5 year cash and equivalents growth rate now stands at 17.4%.
- Its 4 year cash and equivalents growth rate is now at 17.4%.
- Its 5 year revenue growth rate is now at 5.17%.

The table below shows CENX's growth in key financial areas (numbers in millions of US dollars).
Date | Revenue | Operating Cash Flow | Net Income to Common Stock |
---|---|---|---|
2021-12-31 | 2,212.5 | -64.7 | -167.1 |
2021-09-30 | 1,942.5 | -2.5 | -263 |
2021-06-30 | 1,754 | -116.6 | -268.8 |
2021-03-31 | 1,627.9 | -41.5 | -260.6 |
2020-12-31 | 1,605.1 | 42.9 | -123.3 |
2020-09-30 | 1,651.4 | 55.4 | -92.6 |
CENX's Quality Factors
The “Quality” component of the POWR Ratings focuses on 31 different factors of a companies fundamentals and operational strength. Here are some key insights as we drill into the specifics of these quality attributes.- CENX has a Quality Grade of C, ranking ahead of 31.88% of graded US stocks.
- CENX's asset turnover comes in at 1.259 -- ranking 13th of 41 Steel Works Etc stocks.
- TWI, GLW, and FRD are the stocks whose asset turnover ratios are most correlated with CENX.
The table below shows CENX's key quality metrics over time.
Period | Asset Turnover | Gross Margin | ROIC |
---|---|---|---|
2021-06-30 | 1.259 | -0.016 | -0.203 |
2021-03-31 | 1.144 | -0.038 | -0.161 |
2020-12-31 | 1.085 | -0.023 | -0.064 |
2020-09-30 | 1.097 | -0.017 | -0.045 |
2020-06-30 | 1.111 | -0.009 | -0.023 |
2020-03-31 | 1.160 | -0.004 | -0.020 |
CENX Price Target
For more insight on analysts targets of CENX, see our CENX price target page. And for a list of of all stocks sorted by upside potential based on analyst target price, see our Top Price Target page.
Average Price Target | $17.00 | Average Broker Recommendation | 1.75 (Moderate Buy) |
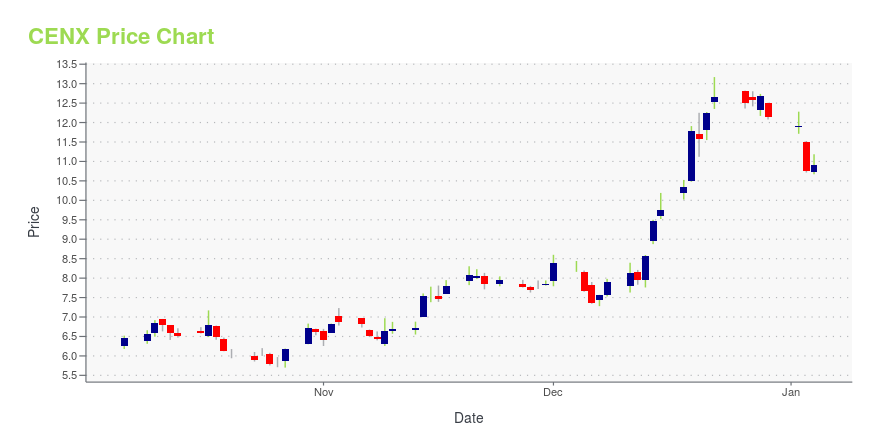
CENX Stock Price Chart Interactive Chart >
CENX Price/Volume Stats
Current price | $12.37 | 52-week high | $30.36 |
Prev. close | $11.76 | 52-week low | $10.39 |
Day low | $11.66 | Volume | 2,216,900 |
Day high | $12.38 | Avg. volume | 2,002,510 |
50-day MA | $20.25 | Dividend yield | N/A |
200-day MA | $17.04 | Market Cap | 1.13B |
Century Aluminum Company (CENX) Company Bio
Century Aluminum Company produces primary aluminum in the United States and Iceland. It produces standard grade and value-added primary aluminum products; and carbon products, such as anodes and cathodes. The company was founded in 1995 and is based in Chicago, Illinois.
Latest CENX News From Around the Web
Below are the latest news stories about Century Aluminum Co that investors may wish to consider to help them evaluate CENX as an investment opportunity.
Century Aluminum Co (CENX) CEO Jesse Gary on Q4 2021 Results - Earnings Call TranscriptCentury Aluminum Co (CENX) Q4 2021 Earnings Conference Call February 24, 2022, 17:00 ET Company Participants Peter Trpkovski - Finance Manager Jesse Gary - President, CEO & Director Craig Conti - EVP, CFO & Principal Financial Officer Conference Call Participants David Gagliano - BMO Capital Markets Timna Tanners - Wolfe... |
Century Aluminum Company Reports Fourth Quarter 2021 ResultsCHICAGO, Feb. 24, 2022 (GLOBE NEWSWIRE) -- Century Aluminum Company (NASDAQ: CENX) today announced its fourth quarter and full year 2021 results. 2021 Business Highlights Realized LME aluminum price of $2,605/T in fourth quarter is up $230/T from prior quarterRealized regional premiums of $720/T and $340/T for U.S. Midwest and EU Duty Paid, respectively. These were up $50/T and $95/T from prior quarter, respectivelyStarted construction of expansion project into low-carbon billet production for o |
Century Aluminum announces cybersecurity incursionOn February 16, 2022, Century Aluminum (CENX) detected a cyber incursion affecting some of the servers supporting its global operations |
Century Aluminum Cybersecurity Incursion; No Current Material Impact to ProductionOn February 16, 2022, Century Aluminum Company (NASDAQ: CENX) detected a cyber incursion affecting some of the servers supporting our global operations. The Company took immediate action by shutting down all impacted information systems and activating the Company's internal response procedures and mobilizing both internal resources and third-party experts to address the situation as quickly as possible. |
Aluminum Stocks AA, KALU, CENX Pop on Record Prices Amid Ukraine Conflict FearsAluminum stocks are rising as global supply of the metal is threatened by geopolitical forces. |
CENX Price Returns
1-mo | -36.01% |
3-mo | -46.17% |
6-mo | -11.77% |
1-year | -9.11% |
3-year | 105.14% |
5-year | -16.59% |
YTD | -25.30% |
2021 | 50.14% |
2020 | 46.77% |
2019 | 2.80% |
2018 | -62.78% |
2017 | 129.44% |
Continue Researching CENX
Want to see what other sources are saying about Century Aluminum Co's financials and stock price? Try the links below:Century Aluminum Co (CENX) Stock Price | Nasdaq
Century Aluminum Co (CENX) Stock Quote, History and News - Yahoo Finance
Century Aluminum Co (CENX) Stock Price and Basic Information | MarketWatch
Loading social stream, please wait...