Coherus BioSciences, Inc. (CHRS): Price and Financial Metrics
CHRS Price/Volume Stats
Current price | $1.94 | 52-week high | $10.99 |
Prev. close | $2.06 | 52-week low | $1.43 |
Day low | $1.89 | Volume | 2,546,600 |
Day high | $2.06 | Avg. volume | 2,787,592 |
50-day MA | $3.16 | Dividend yield | N/A |
200-day MA | $5.05 | Market Cap | 216.05M |
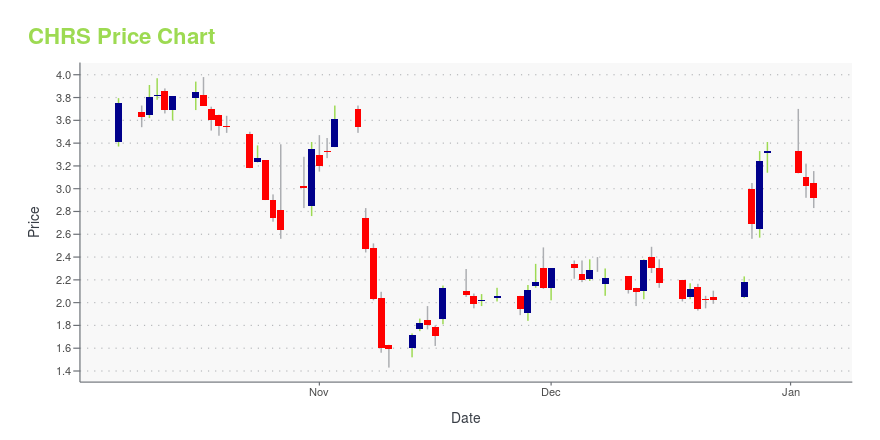
CHRS Stock Price Chart Interactive Chart >
CHRS POWR Grades
- Growth is the dimension where CHRS ranks best; there it ranks ahead of 83.8% of US stocks.
- The strongest trend for CHRS is in Growth, which has been heading up over the past 177 days.
- CHRS's current lowest rank is in the Stability metric (where it is better than 0.72% of US stocks).
CHRS Stock Summary
- The capital turnover (annual revenue relative to shareholder's equity) for CHRS is -1.58 -- better than merely 4.81% of US stocks.
- CHRS's equity multiplier -- a measure of assets relative to shareholders'equity -- is greater than that of just 4.25% of US stocks.
- COHERUS BIOSCIENCES INC's shareholder yield -- a measure of how much capital is returned to stockholders via dividends and buybacks -- is -45.41%, greater than the shareholder yield of merely 11.05% of stocks in our set.
- Stocks that are quantitatively similar to CHRS, based on their financial statements, market capitalization, and price volatility, are NSPR, TARS, SERA, VLCN, and CLPT.
- Visit CHRS's SEC page to see the company's official filings. To visit the company's web site, go to www.coherus.com.
CHRS Valuation Summary
- In comparison to the median Healthcare stock, CHRS's price/sales ratio is 47.22% lower, now standing at 1.9.
- CHRS's EV/EBIT ratio has moved up 1.2 over the prior 109 months.
Below are key valuation metrics over time for CHRS.
Stock | Date | P/S | P/B | P/E | EV/EBIT |
---|---|---|---|---|---|
CHRS | 2023-11-03 | 1.9 | -2.0 | -1.3 | -3.3 |
CHRS | 2023-11-02 | 1.7 | -1.8 | -1.2 | -3.1 |
CHRS | 2023-11-01 | 1.7 | -1.7 | -1.1 | -3.1 |
CHRS | 2023-10-31 | 1.7 | -1.8 | -1.2 | -3.2 |
CHRS | 2023-10-30 | 1.6 | -1.6 | -1.1 | -3.0 |
CHRS | 2023-10-27 | 1.4 | -1.4 | -0.9 | -2.9 |
CHRS Growth Metrics
- The year over year revenue growth rate now stands at -31.41%.
- Its year over year net income to common stockholders growth rate is now at -175.63%.
- The 2 year cash and equivalents growth rate now stands at 68.53%.

The table below shows CHRS's growth in key financial areas (numbers in millions of US dollars).
Date | Revenue | Operating Cash Flow | Net Income to Common Stock |
---|---|---|---|
2022-09-30 | 239.061 | -193.493 | -278.609 |
2022-06-30 | 276.14 | -142.693 | -230.487 |
2022-03-31 | 303.632 | -92.844 | -210.237 |
2021-12-31 | 326.551 | -37.432 | -287.1 |
2021-09-30 | 363.599 | 48.014 | -231.667 |
2021-06-30 | 394.647 | 81.656 | -165.206 |
CHRS's Quality Factors
The “Quality” component of the POWR Ratings focuses on 31 different factors of a companies fundamentals and operational strength. Here are some key insights as we drill into the specifics of these quality attributes.- CHRS has a Quality Grade of B, ranking ahead of 82.07% of graded US stocks.
- CHRS's asset turnover comes in at 0.513 -- ranking 78th of 682 Pharmaceutical Products stocks.
- CPRX, XTNT, and VIVO are the stocks whose asset turnover ratios are most correlated with CHRS.
The table below shows CHRS's key quality metrics over time.
Period | Asset Turnover | Gross Margin | ROIC |
---|---|---|---|
2021-06-30 | 0.513 | 0.886 | -0.228 |
2021-03-31 | 0.572 | 0.913 | -0.075 |
2020-12-31 | 0.664 | 0.921 | 0.250 |
2020-09-30 | 0.803 | 0.931 | 0.332 |
2020-06-30 | 0.995 | 0.936 | 0.477 |
2020-03-31 | 1.206 | 0.950 | 0.576 |
CHRS Price Target
For more insight on analysts targets of CHRS, see our CHRS price target page. And for a list of of all stocks sorted by upside potential based on analyst target price, see our Top Price Target page.
Average Price Target | $25.71 | Average Broker Recommendation | 1.57 (Moderate Buy) |
Coherus BioSciences, Inc. (CHRS) Company Bio
Coherus Biosciences is a pure-play biosimilar platform company that develops and commercializes high-quality therapeutics for major regulated markets. The company was founded in 2010 and is based in Redwood City, California.
Latest CHRS News From Around the Web
Below are the latest news stories about COHERUS BIOSCIENCES INC that investors may wish to consider to help them evaluate CHRS as an investment opportunity.
Why Coherus BioSciences Was Plummeting This WeekA disappointing quarter combined with a set of analyst price target cuts -- and even a recommendation downgrade -- made Coherus BioSciences (NASDAQ: CHRS) a stock to avoid this week. As of mid-afternoon Friday, according to data compiled by S&P Global Market Intelligence, the healthcare company's share price had fallen by a steep 56% week to date. On Monday after market close, Coherus unveiled a set of third-quarter results that, despite a double-digit revenue increase, missed analyst estimates. |
Today’s Biggest Pre-Market Stock Movers: 10 Top Gainers and Losers on TuesdayIt's time for another dive into the biggest pre-market stock movers as we break down all of the latest news for Tuesday morning. |
Why Coherus Biosciences Stock Dropped TodayShares of Coherus Biosciences (NASDAQ: CHRS) were down by about 30% as of 3:25 p.m. ET Tuesday after the company announced disappointing third-quarter results and lowered its full-year guidance. It generated $40 million of net sales of Cimerli, which treats retinal conditions -- up 50% from the prior quarter -- and $1.4 million from arthritis treatment Yusimry. Coherus highlighted its recently resubmitted biologic license application for Udenyca OnBody, its on-body injector presentation of Udenyca, after the completion and satisfactory resolution of a Food and Drug Administration (FDA) review of inspection findings at a third-party filler. |
Coherus BioSciences, Inc. (NASDAQ:CHRS) Q3 2023 Earnings Call TranscriptCoherus BioSciences, Inc. (NASDAQ:CHRS) Q3 2023 Earnings Call Transcript November 7, 2023 Operator: Good day and thank you for standing by. Welcome to the Coherus Biosciences Third Quarter 2023 Conference Call. At this time all participants are in a listen-only mode. After the speakers’ presentation, there will be a question-and-answer session. [Operator Instructions] Please be […] |
Q3 2023 Coherus BioSciences Inc Earnings CallQ3 2023 Coherus BioSciences Inc Earnings Call |
CHRS Price Returns
1-mo | -26.52% |
3-mo | -62.98% |
6-mo | -52.10% |
1-year | -69.88% |
3-year | -89.58% |
5-year | -81.99% |
YTD | -75.51% |
2022 | -50.38% |
2021 | -8.17% |
2020 | -3.47% |
2019 | 98.95% |
2018 | 2.84% |
Continue Researching CHRS
Want to do more research on Coherus BioSciences Inc's stock and its price? Try the links below:Coherus BioSciences Inc (CHRS) Stock Price | Nasdaq
Coherus BioSciences Inc (CHRS) Stock Quote, History and News - Yahoo Finance
Coherus BioSciences Inc (CHRS) Stock Price and Basic Information | MarketWatch
Loading social stream, please wait...