
Cohen & Company Inc. (COHN): Price and Financial Metrics
COHN Price/Volume Stats
| Current price | $6.51 | 52-week high | $11.99 |
| Prev. close | $6.65 | 52-week low | $3.29 |
| Day low | $6.41 | Volume | 1,469 |
| Day high | $6.62 | Avg. volume | 7,910 |
| 50-day MA | $7.00 | Dividend yield | 15.8% |
| 200-day MA | $7.01 | Market Cap | 12.54M |
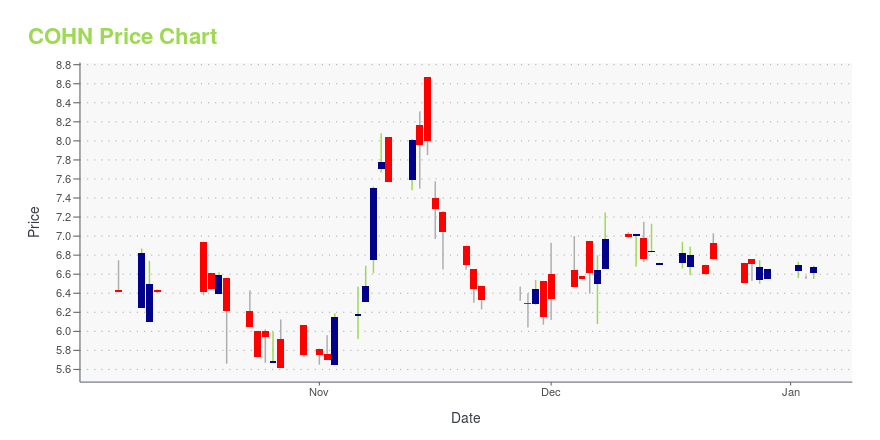
COHN Stock Price Chart Interactive Chart >
Cohen & Company Inc. (COHN) Company Bio
Cohen & Company Inc. is a publicly owned investment manager. The firm primarily provides its services to individuals and institutions. It manages separate client-focused fixed income portfolios. Institutional Financial Markets, Inc. also manages funds and collateralized debt obligations for its clients. It invests in the fixed income and alternative investment markets across the globe. The firm's fixed income investments include U.S. trust preferred securities, European hybrid capital securities, Asian commercial real estate debt, mortgage backed securities, and asset backed securities. The firm was formerly known as Institutional Financial Markets, Inc. Cohen & Company Inc. was founded in 1999 and is based in Philadelphia, Pennsylvania with additional offices in New York City; Boca Raton, Florida; Chicago, Illinois; Bethesda, Maryland; Boston, Massachusetts; Paris, France; and London, United Kingdom.
Latest COHN News From Around the Web
Below are the latest news stories about COHEN & CO INC that investors may wish to consider to help them evaluate COHN as an investment opportunity.
Cohen & Company Reports Third Quarter 2023 Financial ResultsBoard Declares Quarterly Dividend of $0.25 per SharePHILADELPHIA and NEW YORK, Nov. 02, 2023 (GLOBE NEWSWIRE) -- Cohen & Company Inc. (NYSE American: COHN), a financial services firm specializing in an expanding range of capital markets and asset management services, today reported financial results for its third quarter ended September 30, 2023. Summary Operating Results ($ in thousands)Three Months Ended Nine Months Ended 9/30/23 6/30/23 9/30/22 9/30/23 9/30/22 Net trading$ 7,491 $ 7,416 $ 7,9 |
Cohen & Company Capital Markets Continues Strong Momentum, Appoints Gary Quin Senior Advisor, EMEA Investment Banking to Expand Global ReachCohen & Company Capital Markets ("CCM") is pleased to announce the appointment of Gary Quin as Senior Advisor, who will lead CCM's efforts in Europe, the Middle East, and Africa (EMEA). |
Cohen & Company Reports Second Quarter 2023 Financial ResultsBoard Declares Quarterly Dividend of $0.25 per SharePHILADELPHIA and NEW YORK, Aug. 02, 2023 (GLOBE NEWSWIRE) -- Cohen & Company Inc. (NYSE American: COHN), a financial services firm specializing in an expanding range of capital markets and asset management services, today reported financial results for its second quarter ended June 30, 2023. Summary Operating Results Three Months Ended Six Months Ended($ in thousands)6/30/23 3/31/23 6/30/22 6/30/23 6/30/22 Net trading$7,416 $8,210 $10,377 $15,6 |
3 Doomed Dividend Stocks Destined for DisasterAlthough it’s nice to diversify your portfolio with passive income, these doomed dividend stocks will give you more than bargained for. |
Cohen & Company Reports First Quarter 2023 Financial ResultsBoard Declares Quarterly Dividend of $0.25 per SharePHILADELPHIA and NEW YORK, May 04, 2023 (GLOBE NEWSWIRE) -- Cohen & Company Inc. (NYSE American: COHN), a financial services firm specializing in an expanding range of capital markets and asset management services, today reported financial results for its first quarter ended March 31, 2023. Summary Operating Results Three Months Ended($ in thousands) 3/31/23 12/31/22 3/31/22 Net trading $8,210 $9,644 $12,022 Asset management 2,025 1,761 1,889 N |
COHN Price Returns
| 1-mo | -1.81% |
| 3-mo | -3.37% |
| 6-mo | 23.71% |
| 1-year | 14.10% |
| 3-year | -72.31% |
| 5-year | 49.06% |
| YTD | 1.28% |
| 2023 | -9.69% |
| 2022 | -36.73% |
| 2021 | -6.90% |
| 2020 | 313.55% |
| 2019 | -50.28% |
COHN Dividends
| Ex-Dividend Date | Type | Payout Amount | Change | ||||||
|---|---|---|---|---|---|---|---|---|---|
| Loading, please wait... | |||||||||
Continue Researching COHN
Want to see what other sources are saying about Cohen & Co Inc's financials and stock price? Try the links below:Cohen & Co Inc (COHN) Stock Price | Nasdaq
Cohen & Co Inc (COHN) Stock Quote, History and News - Yahoo Finance
Cohen & Co Inc (COHN) Stock Price and Basic Information | MarketWatch
Loading social stream, please wait...