Curis, Inc. (CRIS): Price and Financial Metrics
CRIS Price/Volume Stats
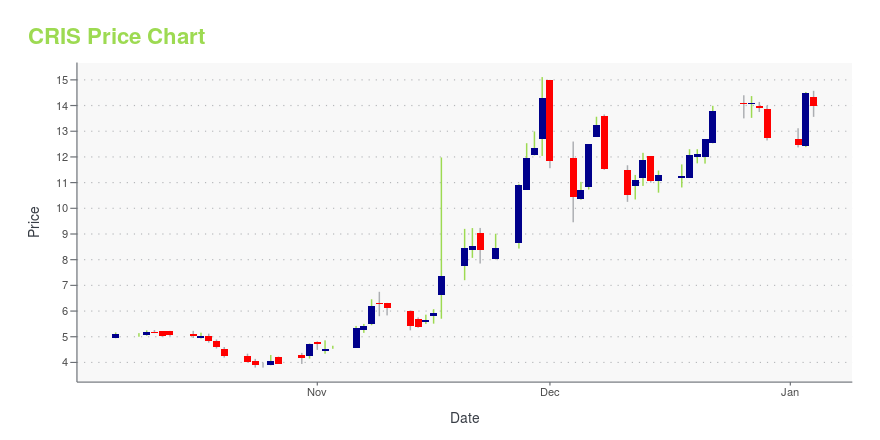
Current price | $11.54 | 52-week high | $20.00 |
Prev. close | $13.23 | 52-week low | $3.80 |
Day low | $11.50 | Volume | 80,900 |
Day high | $13.65 | Avg. volume | 37,286 |
50-day MA | $6.73 | Dividend yield | N/A |
200-day MA | $12.29 | Market Cap | 67.89M |
CRIS Stock Price Chart Interactive Chart >
CRIS POWR Grades
- CRIS scores best on the Sentiment dimension, with a Sentiment rank ahead of 86.03% of US stocks.
- The strongest trend for CRIS is in Growth, which has been heading down over the past 177 days.
- CRIS ranks lowest in Momentum; there it ranks in the 4th percentile.
CRIS Stock Summary
- For CRIS, its debt to operating expenses ratio is greater than that reported by only 10.67% of US equities we're observing.
- With a year-over-year growth in debt of -26.38%, CURIS INC's debt growth rate surpasses only 12.41% of about US stocks.
- In terms of volatility of its share price, CRIS is more volatile than 99.39% of stocks we're observing.
- If you're looking for stocks that are quantitatively similar to CURIS INC, a group of peers worth examining would be BCDA, ALGS, RXRX, TSP, and GSIT.
- Visit CRIS's SEC page to see the company's official filings. To visit the company's web site, go to www.curis.com.
CRIS Valuation Summary
- CRIS's price/sales ratio is 4.9; this is 164.86% higher than that of the median Healthcare stock.
- CRIS's price/sales ratio has moved down 2.5 over the prior 243 months.
Below are key valuation metrics over time for CRIS.
Stock | Date | P/S | P/B | P/E | EV/EBIT |
---|---|---|---|---|---|
CRIS | 2023-11-20 | 4.9 | 1.7 | -1.1 | -0.6 |
CRIS | 2023-11-17 | 4.2 | 1.5 | -0.9 | -0.5 |
CRIS | 2023-11-16 | 3.4 | 1.2 | -0.7 | -0.3 |
CRIS | 2023-11-15 | 3.3 | 1.1 | -0.7 | -0.3 |
CRIS | 2023-11-14 | 3.1 | 1.1 | -0.7 | -0.2 |
CRIS | 2023-11-13 | 3.1 | 1.1 | -0.7 | -0.2 |
CRIS Growth Metrics
- Its 3 year net cashflow from operations growth rate is now at -34.36%.
- Its 2 year cash and equivalents growth rate is now at 36.79%.
- Its 5 year cash and equivalents growth rate is now at -68.17%.

The table below shows CRIS's growth in key financial areas (numbers in millions of US dollars).
Date | Revenue | Operating Cash Flow | Net Income to Common Stock |
---|---|---|---|
2022-09-30 | 10.41 | -50.24 | -58.963 |
2022-06-30 | 10.624 | -46.728 | -56.72 |
2022-03-31 | 10.517 | -41.255 | -51.618 |
2021-12-31 | 10.649 | -37.619 | -45.436 |
2021-09-30 | 10.538 | -35.163 | -39.333 |
2021-06-30 | 10.241 | -31.43 | -34.256 |
CRIS's Quality Factors
The “Quality” component of the POWR Ratings focuses on 31 different factors of a companies fundamentals and operational strength. Here are some key insights as we drill into the specifics of these quality attributes.- CRIS has a Quality Grade of C, ranking ahead of 36.2% of graded US stocks.
- CRIS's asset turnover comes in at 0.066 -- ranking 302nd of 682 Pharmaceutical Products stocks.
- YMTX, VTRS, and KDNY are the stocks whose asset turnover ratios are most correlated with CRIS.
The table below shows CRIS's key quality metrics over time.
Period | Asset Turnover | Gross Margin | ROIC |
---|---|---|---|
2021-06-30 | 0.066 | 0.950 | -0.571 |
2021-03-31 | 0.085 | 0.950 | -0.771 |
2020-12-31 | 0.135 | 0.951 | -1.416 |
2020-09-30 | 0.291 | 0.951 | -5.061 |
2020-06-30 | 0.301 | 0.951 | -6.257 |
2020-03-31 | 0.287 | 0.952 | -7.307 |
CRIS Price Target
For more insight on analysts targets of CRIS, see our CRIS price target page. And for a list of of all stocks sorted by upside potential based on analyst target price, see our Top Price Target page.
Average Price Target | $23.00 | Average Broker Recommendation | 1.5 (Moderate Buy) |
Curis, Inc. (CRIS) Company Bio
Curis, Inc. engages in the discovery and development of drug candidates for the treatment of human cancers. The company was founded in 2000 and is based in Lexington, Massachusetts.
Latest CRIS News From Around the Web
Below are the latest news stories about CURIS INC that investors may wish to consider to help them evaluate CRIS as an investment opportunity.
Curis Announces Three Presentations at ASHCuris, Inc. (NASDAQ: CRIS), a biotechnology company focused on the development of emavusertib (CA-4948), an orally available, small molecule IRAK4 inhibitor, today announced that the Company along with its collaborative partners will be presenting three posters at the upcoming 65th ASH Annual Meeting and Exposition (ASH 2025) being held in San Diego, California and online from December 9th to December 12th. |
Curis Enters into Agreement for Emavusertib / Pembrolizumab Combination Study in MelanomaCuris, Inc. (NASDAQ: CRIS), a biotechnology company focused on the development of emavusertib (CA-4948), an orally available, small molecule IRAK4 inhibitor, today announced that it has entered into an investigator-initiated clinical trial agreement with the University of Florida to study the combination of emavusertib and pembrolizumab in patients with metastatic melanoma. |
Curis, Inc. (NASDAQ:CRIS) Q3 2023 Earnings Call TranscriptCuris, Inc. (NASDAQ:CRIS) Q3 2023 Earnings Call Transcript November 2, 2023 Curis, Inc. beats earnings expectations. Reported EPS is $-2.13, expectations were $-2.32. Operator: Good morning, and welcome to Curis’ Third Quarter 2023 Business Update Call. All participants will be in a listen-only mode. [Operator Instructions] After the company’s prepared remarks, all participants will have […] |
Curis Inc (CRIS) Reports Q3 2023 Financial Results: Net Loss Decreases Year-Over-YearCompany Continues Progress on Emavusertib Development, Maintains Strong Balance Sheet |
Curis Provides Third Quarter 2023 Business UpdateCuris, Inc. (NASDAQ: CRIS), a biotechnology company focused on the development of emavusertib, an orally available, small molecule IRAK4 inhibitor for the treatment of hematologic malignancies, today reported its business update and financial results for the quarter ended September 30, 2023. |
CRIS Price Returns
1-mo | 83.57% |
3-mo | 9.28% |
6-mo | -29.55% |
1-year | -25.07% |
3-year | -92.50% |
5-year | -16.38% |
YTD | 4.91% |
2022 | -88.45% |
2021 | -41.88% |
2020 | 381.76% |
2019 | 146.38% |
2018 | -80.29% |
Continue Researching CRIS
Want to do more research on Curis Inc's stock and its price? Try the links below:Curis Inc (CRIS) Stock Price | Nasdaq
Curis Inc (CRIS) Stock Quote, History and News - Yahoo Finance
Curis Inc (CRIS) Stock Price and Basic Information | MarketWatch
Loading social stream, please wait...