
The Dixie Group, Inc. (DXYN): Price and Financial Metrics
DXYN Price/Volume Stats
| Current price | $0.52 | 52-week high | $1.36 |
| Prev. close | $0.54 | 52-week low | $0.46 |
| Day low | $0.50 | Volume | 25,300 |
| Day high | $0.54 | Avg. volume | 44,787 |
| 50-day MA | $0.56 | Dividend yield | N/A |
| 200-day MA | $0.72 | Market Cap | 8.12M |
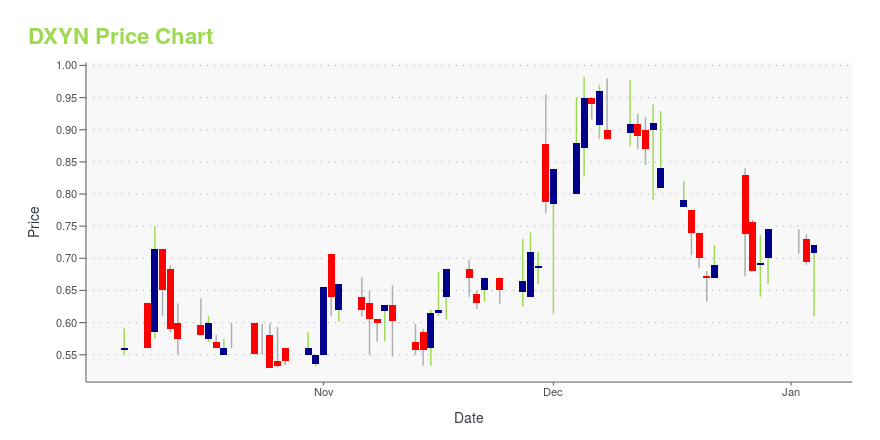
DXYN Stock Price Chart Interactive Chart >
The Dixie Group, Inc. (DXYN) Company Bio
The Dixie Group markets and manufactures carpet and rugs to higher-end residential and commercial customers through the Fabrica International, Masland Carpets, Dixie Home, Atlas Carpet Mills, Masland Contract, Masland Hospitality and Avant brands. The company was founded in 1920 and is based in Chattanooga, Tennessee.
Latest DXYN News From Around the Web
Below are the latest news stories about DIXIE GROUP INC that investors may wish to consider to help them evaluate DXYN as an investment opportunity.
The Dixie Group, Inc. (NASDAQ:DXYN) Q3 2023 Earnings Call TranscriptThe Dixie Group, Inc. (NASDAQ:DXYN) Q3 2023 Earnings Call Transcript November 13, 2023 Operator: Good day and welcome to the Dixie Group, Inc. 2023 Third Quarter Earning Conference Call. Today’s call is being recorded. At this time for opening remarks, I’ll turn the floor over to Chairman and Chief Executive Officer, Dan Frierson. Please go […] |
The Dixie Group Reports Operating Income for Third Quarter of 2023Highlights from the Third Quarter 2023:The gross profit margin for the three months of the third quarter of 2023 was 26.6% of net sales compared to 17.5% in the third quarter of 2022The net operating loss for the first nine months of 2023 was $354 ... |
CORRECTION BY SOURCE: The Dixie Group 2023 Q3 Earnings Release Conference CallThe following corrects the conference call day in a release disseminated earlier todayDALTON, GA / ACCESSWIRE / November 10, 2023 / Due to the observance of the Veterans' Day holiday, The Dixie Group is postponing its earnings call originally scheduled ... |
The Dixie Group 2023 Q3 Earnings Release and Conference CallDALTON, GA / ACCESSWIRE / November 10, 2023 / Due to the observance of the Veterans' Day holiday, The Dixie Group is postponing its earnings call originally scheduled for today at 11:00 am EST until Monday, November 13, 2023, at 10:00 am EST.To participate ... |
The Dixie Group, Inc. (NASDAQ:DXYN) Q2 2023 Earnings Call TranscriptThe Dixie Group, Inc. (NASDAQ:DXYN) Q2 2023 Earnings Call Transcript August 4, 2023 Operator: Good day, and welcome to The Dixie Group, Inc. 2023 Second Quarter Earnings Conference Call. Today’s call is being recorded. At this time, for opening remarks and introductions, I would like to turn the call over to the Chairman and Chief […] |
DXYN Price Returns
| 1-mo | -7.59% |
| 3-mo | -16.13% |
| 6-mo | -2.44% |
| 1-year | -27.78% |
| 3-year | -84.05% |
| 5-year | -40.91% |
| YTD | -30.15% |
| 2023 | -4.92% |
| 2022 | -86.34% |
| 2021 | 124.71% |
| 2020 | 123.68% |
| 2019 | 60.56% |
Continue Researching DXYN
Here are a few links from around the web to help you further your research on Dixie Group Inc's stock as an investment opportunity:Dixie Group Inc (DXYN) Stock Price | Nasdaq
Dixie Group Inc (DXYN) Stock Quote, History and News - Yahoo Finance
Dixie Group Inc (DXYN) Stock Price and Basic Information | MarketWatch
Loading social stream, please wait...