
Entergy Corp. (ETR): Price and Financial Metrics
ETR Price/Volume Stats
| Current price | $103.75 | 52-week high | $109.85 |
| Prev. close | $103.19 | 52-week low | $87.10 |
| Day low | $102.33 | Volume | 1,802,800 |
| Day high | $103.93 | Avg. volume | 1,367,712 |
| 50-day MA | $102.25 | Dividend yield | 4.42% |
| 200-day MA | $99.19 | Market Cap | 22.12B |
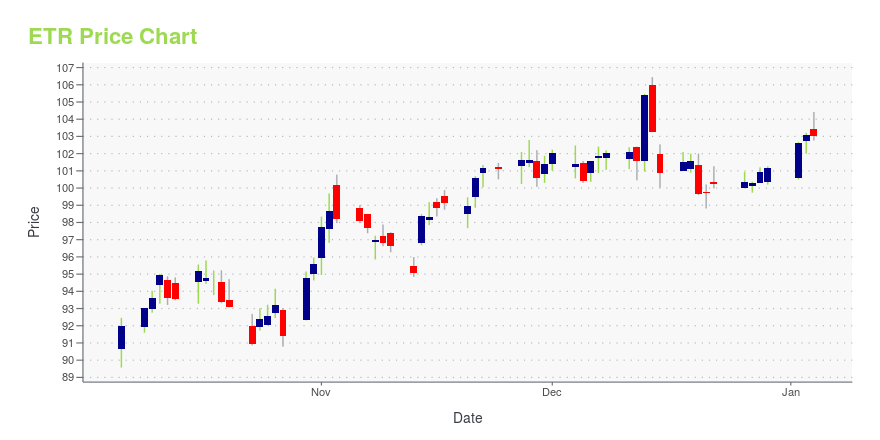
ETR Stock Price Chart Interactive Chart >
Entergy Corp. (ETR) Company Bio
Dover Corporation is an American conglomerate manufacturer of industrial products. The Downers Grove, Illinois-based company was founded in 1955. As of 2021, Dover's business was divided into five segments: Engineered Products, Clean Energy and Fueling, Imaging & Identification, Pumps & Process Solutions and Climate and Sustainability Technologies. Dover is a constituent of the S&P 500 index and trades on the New York Stock Exchange under "DOV". Dover was ranked 429th in the 2020 Fortune 500. The company relocated its headquarters to Illinois from New York in mid-2010. (Source:Wikipedia)
Latest ETR News From Around the Web
Below are the latest news stories about ENTERGY CORP that investors may wish to consider to help them evaluate ETR as an investment opportunity.
Power Plays: 3 Utility Stocks to Snap Up Before the New YearHere are three utility stocks that analysts view as good long-term investments for steady portfolio growth and recurring dividend income. |
15 Undervalued Defensive Stocks For 2024In this article, we discuss the 15 undervalued defensive stocks for 2024. To skip the detailed overview of the market and defensive stocks, go directly to the 5 Undervalued Defensive Stocks For 2024. Defensive stocks are shares of companies that remain relatively stable during economic downturns as opposed to cyclical stocks. Defensive stocks usually outperform […] |
Here's Why Entergy (ETR) is a Strong Value StockThe Zacks Style Scores offers investors a way to easily find top-rated stocks based on their investing style. Here's why you should take advantage. |
Entergy Texas declares quarterly dividend on preferred stockThe Entergy Texas, Inc. board of directors has declared a quarterly dividend payment of $0.3359375 per share on its Series A Preferred Stock. The dividend is payable Jan. 15, 2024, to shareholders of record as of Jan. 3, 2024. |
Entergy Brightens Customers’ Spirits This Holiday Through Its Annual "Operation Secret Santa"NORTHAMPTON, MA / ACCESSWIRE / December 21, 2023 / Entergy Corporation BY: CRISTINA DEL CANTO Entergy recently spread some holiday cheer through our annual initiative called "Operation Secret Santa." Lucky first-in-line customers at our Canal Street ... |
ETR Price Returns
| 1-mo | 0.71% |
| 3-mo | 5.93% |
| 6-mo | 14.09% |
| 1-year | -0.14% |
| 3-year | 8.14% |
| 5-year | 34.09% |
| YTD | 3.72% |
| 2023 | -6.09% |
| 2022 | 3.55% |
| 2021 | 17.12% |
| 2020 | -13.73% |
| 2019 | 44.31% |
ETR Dividends
| Ex-Dividend Date | Type | Payout Amount | Change | ||||||
|---|---|---|---|---|---|---|---|---|---|
| Loading, please wait... | |||||||||
Continue Researching ETR
Want to do more research on Entergy Corp's stock and its price? Try the links below:Entergy Corp (ETR) Stock Price | Nasdaq
Entergy Corp (ETR) Stock Quote, History and News - Yahoo Finance
Entergy Corp (ETR) Stock Price and Basic Information | MarketWatch
Loading social stream, please wait...