
Gambling.com Group Ltd (GAMB): Price and Financial Metrics
GAMB Price/Volume Stats
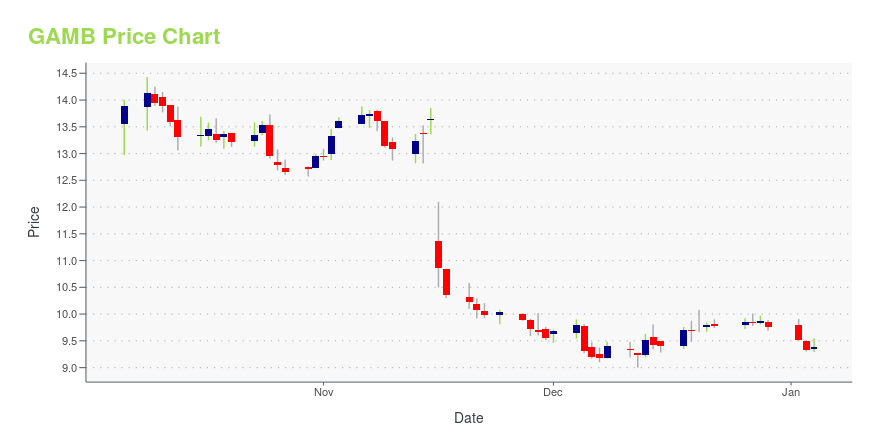
| Current price | $8.70 | 52-week high | $14.83 |
| Prev. close | $8.51 | 52-week low | $8.35 |
| Day low | $8.45 | Volume | 188,700 |
| Day high | $8.71 | Avg. volume | 144,417 |
| 50-day MA | $8.91 | Dividend yield | N/A |
| 200-day MA | $10.99 | Market Cap | 323.84M |
GAMB Stock Price Chart Interactive Chart >
Gambling.com Group Ltd (GAMB) Company Bio
Gambling.com Group Limited operates as a performance marketing company for the online gambling industry worldwide. The company provides digital marketing services for the iGaming and sports betting. It publishes various branded websites, including Gambling.com and Bookies.com. Gambling.com Group Limited was incorporated in 2006 and is headquartered in Dublin, Ireland.
Latest GAMB News From Around the Web
Below are the latest news stories about GAMBLINGCOM GROUP LTD that investors may wish to consider to help them evaluate GAMB as an investment opportunity.
Gambling.com Group Limited (NASDAQ:GAMB) Q3 2023 Earnings Call TranscriptGambling.com Group Limited (NASDAQ:GAMB) Q3 2023 Earnings Call Transcript November 15, 2023 Gambling.com Group Limited beats earnings expectations. Reported EPS is $0.13, expectations were $0.11. Operator: Greetings, welcome to Gambling.com Group’s Third Quarter 2023 Earnings Conference Call. At this time, all participants are in a listen-only mode. A question-and-answer session will follow the formal presentation. […] |
Gambling.com Group Revenue Grows 19% to a Q3 Record of $23.5 Million Driven by 42% Increase in North American RevenueCHARLOTTE, N.C., November 15, 2023--Gambling.com Group Limited (Nasdaq: GAMB) ("Gambling.com Group" or the "Company"), a leading provider of digital marketing services for the global online gambling industry, today reported record third quarter financial results for the three months ended September 30, 2023. The Company also reiterated its guidance for 2023 full-year revenue and Adjusted EBITDA. |
Why We Like The Returns At Gambling.com Group (NASDAQ:GAMB)If you're not sure where to start when looking for the next multi-bagger, there are a few key trends you should keep an... |
Gambling.com Group to Report 2023 Third Quarter Results on November 15 and Host Conference Call and WebcastCHARLOTTE, N.C., October 25, 2023--Gambling.com Group Limited (Nasdaq: GAMB) ("Gambling.com Group" or the "Company"), a leading provider of player acquisition services for the regulated global online gambling industry, today announced it will release its 2023 third quarter results after the market close on Wednesday, November 15, 2023, and host a conference call and simultaneous webcast at 4:30 p.m. ET that day. During the call, Gambling.com Group Chief Executive Officer and Co-founder, Charles |
Gambling.com Group Announces 2023 American Gambling Awards WinnersNEW YORK, October 09, 2023--The 2023 edition of the American Gambling Awards is pleased to announce the full list of 11 winners recognized for their leadership and innovation within the regulated, online U.S. gambling industry. The American Gambling Awards are produced by Gambling.com Group Limited (Nasdaq: GAMB) ("Gambling.com Group" or the "Group"), a leading provider of player acquisition services for the regulated global online gambling industry. |
GAMB Price Returns
| 1-mo | -1.14% |
| 3-mo | -7.45% |
| 6-mo | -34.83% |
| 1-year | -12.12% |
| 3-year | N/A |
| 5-year | N/A |
| YTD | -10.77% |
| 2023 | 6.56% |
| 2022 | -9.85% |
| 2021 | N/A |
| 2020 | N/A |
| 2019 | N/A |
Loading social stream, please wait...