
Griffon Corporation (GFF): Price and Financial Metrics
GFF Price/Volume Stats
| Current price | $67.81 | 52-week high | $75.18 |
| Prev. close | $69.08 | 52-week low | $27.45 |
| Day low | $67.10 | Volume | 232,300 |
| Day high | $69.77 | Avg. volume | 380,372 |
| 50-day MA | $69.59 | Dividend yield | 0.91% |
| 200-day MA | $52.60 | Market Cap | 3.45B |
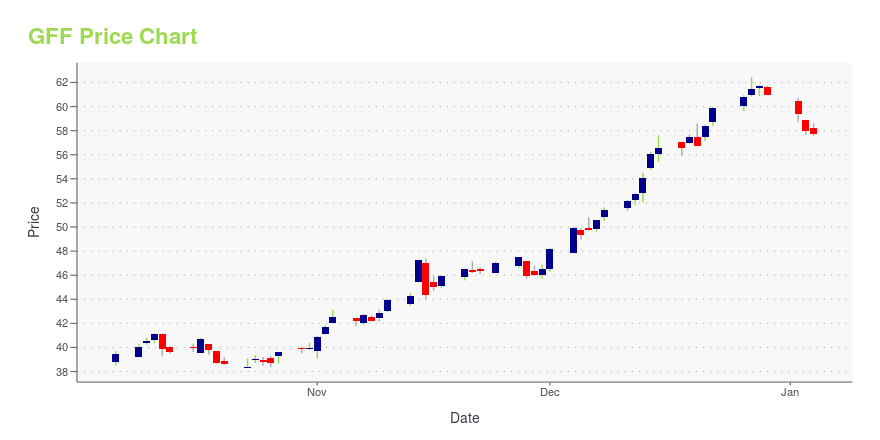
GFF Stock Price Chart Interactive Chart >
Griffon Corporation (GFF) Company Bio
Griffon Corporation manufactures building products, specialty plastic films, and electronic information and communication systems. The Company's products include garage doors, materials for disposable diapers, disposable health-care products, sensor systems, and information and command and control systems. The company was founded in 1959 and is based in New York, New York.
Latest GFF News From Around the Web
Below are the latest news stories about GRIFFON CORP that investors may wish to consider to help them evaluate GFF as an investment opportunity.
Brokers Suggest Investing in Griffon (GFF): Read This Before Placing a BetAccording to the average brokerage recommendation (ABR), one should invest in Griffon (GFF). It is debatable whether this highly sought-after metric is effective because Wall Street analysts' recommendations tend to be overly optimistic. Would it be worth investing in the stock? |
Is Griffon (GFF) Stock Outpacing Its Conglomerates Peers This Year?Here is how Griffon (GFF) and Star Equity (STRR) have performed compared to their sector so far this year. |
Griffon (GFF) Is a Great Choice for 'Trend' Investors, Here's WhyGriffon (GFF) could be a solid choice for shorter-term investors looking to capitalize on the recent price trend in fundamentally sound stocks. It is one of the many stocks that passed through our shorter-term trading strategy-based screen. |
Zacks Industry Outlook Highlights 3M Company, ITT, Federal Signal and Griffon3M Company, ITT, Federal Signal and Griffon have been highlighted in this Industry Outlook article. |
4 Top Stocks to Pick From a Promising Diversified Operations IndustryThe Zacks Diversified Operations industry participants have been benefiting from strength across aerospace, defense and oil & gas industries, along with an improvement in the supply chain. MMM, ITT, FSS and GFF are notable stocks in the industry. |
GFF Price Returns
| 1-mo | -7.11% |
| 3-mo | 13.07% |
| 6-mo | 72.20% |
| 1-year | 164.30% |
| 3-year | 194.13% |
| 5-year | 327.53% |
| YTD | 11.50% |
| 2023 | 83.96% |
| 2022 | 36.91% |
| 2021 | 41.60% |
| 2020 | 1.83% |
| 2019 | 97.72% |
GFF Dividends
| Ex-Dividend Date | Type | Payout Amount | Change | ||||||
|---|---|---|---|---|---|---|---|---|---|
| Loading, please wait... | |||||||||
Continue Researching GFF
Want to see what other sources are saying about Griffon Corp's financials and stock price? Try the links below:Griffon Corp (GFF) Stock Price | Nasdaq
Griffon Corp (GFF) Stock Quote, History and News - Yahoo Finance
Griffon Corp (GFF) Stock Price and Basic Information | MarketWatch
Loading social stream, please wait...