
TD Holdings, Inc. (GLG): Price and Financial Metrics
GLG Price/Volume Stats
| Current price | $2.96 | 52-week high | $3.56 |
| Prev. close | $0.07 | 52-week low | $0.06 |
| Day low | $2.88 | Volume | 196,238 |
| Day high | $3.56 | Avg. volume | 2,512,165 |
| 50-day MA | $0.23 | Dividend yield | N/A |
| 200-day MA | $0.67 | Market Cap | 554.51M |
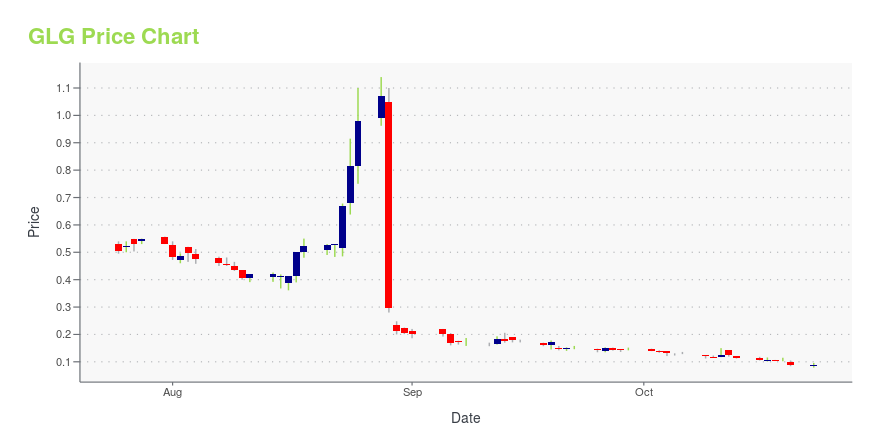
GLG Stock Price Chart Interactive Chart >
TD Holdings, Inc. (GLG) Company Bio
TD Holdings, Inc. focuses on the new commodities trading business. The company was formerly known as Bat Group, Inc. and changed its name to TD Holdings, Inc. in March 2020. TD Holdings, Inc. is based in Beijing, the People's Republic of China.
Latest GLG News From Around the Web
Below are the latest news stories about BAIYU HOLDINGS INC that investors may wish to consider to help them evaluate GLG as an investment opportunity.
BAIYU Holdings, Inc. subsidiary and JD Tech subsidiary signed a service agreement for a payment platform for bulk commodity enterprisesBAIYU Holdings. Inc. (NASDAQ: BYU) (hereinafter referred to as the "Company") announced that its subsidiary Shenzhen Tongdow Internet Technology Co., Ltd. had signed a service agreement with a wholly-owned subsidiary of Beijing Jingdong Financial Technology Holding Co., Ltd. (hereinafter referred to as "JD Tech") to jointly launch a trading payment platform for commodity enterprises. |
BAIYU Holdings, Inc. (Formerly TD Holdings, Inc.) Announces Reverse Stock SplitBAIYU Holdings, Inc. (formerly TD Holdings, Inc.) (Nasdaq: GLG) (the "Company"), a commodities trading service and provider in China, today announced that it plans to change its name from "TD Holdings, Inc." to "BAIYU Holdings, Inc.", its ticker symbol from "GLG" to "BYU", and to effect a 1-for-50 reverse stock split of its shares of common stock, par value $0.001. The expected marketplace effective date for the name and ticker change is October 30, 2023. The Company's common stock is expected t |
Today’s Biggest Pre-Market Stock Movers: 10 Top Gainers and Losers on WednesdayPre-market stock movers are a hot topic on Wednesday morning and we're covering the shares rising and falling this morning! |
TD Holdings, Inc. Enters into a Strategic Cooperation Agreement to Develop Energy Storage Battery Project in Southeast AsiaTD Holdings, Inc. (Nasdaq: GLG) ("the Company"), a commodities trading service provider in China, today announced that it has entered into a strategic cooperation agreement (the "Agreement") with Shenzhen Jintongyuan Energy Storage Technology Co., Ltd. ("Jintongyuan"), a leading tech enterprise specializing in the R&D and production of high-performance energy storage batteries in China, to develop a storage battery project(the "Project") in southeast Asia. The Project represents the Company's am |
Today’s Biggest Pre-Market Stock Movers: 10 Top Gainers and Losers on FridayIt's time to close out this week of trading with an overview of the biggest pre-market stock movers to watch Friday morning! |
GLG Price Returns
| 1-mo | N/A |
| 3-mo | N/A |
| 6-mo | -33.48% |
| 1-year | -93.09% |
| 3-year | -99.10% |
| 5-year | -99.16% |
| YTD | N/A |
| 2023 | 0.00% |
| 2022 | -43.63% |
| 2021 | -73.89% |
| 2020 | 3.92% |
| 2019 | -7.27% |
Continue Researching GLG
Want to see what other sources are saying about Bat Group Inc's financials and stock price? Try the links below:Bat Group Inc (GLG) Stock Price | Nasdaq
Bat Group Inc (GLG) Stock Quote, History and News - Yahoo Finance
Bat Group Inc (GLG) Stock Price and Basic Information | MarketWatch
Loading social stream, please wait...