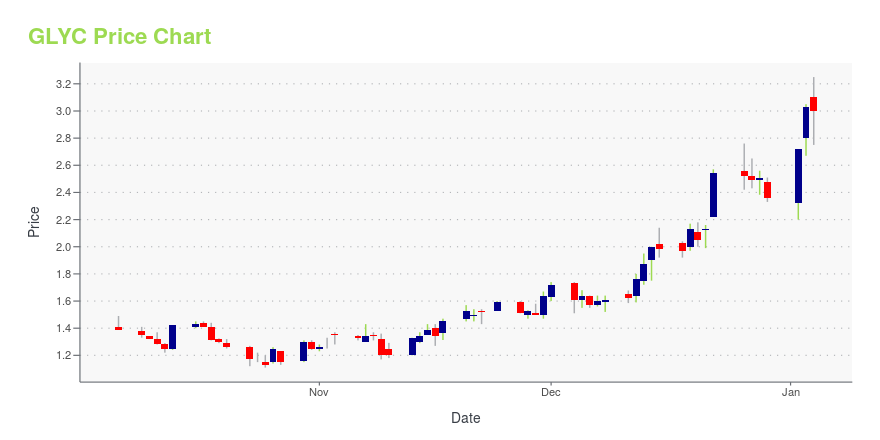
GlycoMimetics, Inc. (GLYC): Price and Financial Metrics
GLYC Price/Volume Stats
| Current price | $2.21 | 52-week high | $3.53 |
| Prev. close | $2.26 | 52-week low | $1.11 |
| Day low | $2.21 | Volume | 414,484 |
| Day high | $2.33 | Avg. volume | 393,063 |
| 50-day MA | $2.87 | Dividend yield | N/A |
| 200-day MA | $2.06 | Market Cap | 142.43M |
GLYC Stock Price Chart Interactive Chart >
GlycoMimetics, Inc. (GLYC) Company Bio
GlycoMimetics, Inc., a clinical stage biotechnology company, focuses on the discovery and development of glycomimetic drugs to address unmet medical needs resulting from diseases in the United States. The company is developing its lead product candidates include rivipansel, a pan-selectin antagonist, which is in Phase III clinical trials for the treatment of vaso-occlusive crisis, a debilitating and painful condition that occurs periodically throughout the life of a person with sickle cell disease; and GMI-1271, an E-selectin antagonist to treat acute myeloid leukemia and other hematologic cancers. The company was founded in 2003 and is based in Rockville, Maryland.
Latest GLYC News From Around the Web
Below are the latest news stories about GLYCOMIMETICS INC that investors may wish to consider to help them evaluate GLYC as an investment opportunity.
Retail investors in GlycoMimetics, Inc. (NASDAQ:GLYC) are its biggest bettors, and their bets paid off as stock gained 23% last weekKey Insights Significant control over GlycoMimetics by retail investors implies that the general public has more power... |
GlycoMimetics Announces Independent Presentations on Uproleselan at American Society of Hematology Annual Meeting including New Clinical Data in Treated Secondary Acute Myeloid LeukemiaROCKVILLE, Md., December 10, 2023--GlycoMimetics, Inc. (Nasdaq: GLYC), a late clinical-stage biotechnology company discovering and developing glycobiology-based therapies for cancers and inflammatory diseases, today announced the 65th American Society of Hematology (ASH) Annual Meeting will feature two presentations on uproleselan, including an investigator-initiated trial (IIT) studying the first-in-class E-selectin antagonist in patients with treated secondary Acute Myeloid Leukemia (ts-AML). |
Is GlycoMimetics (NASDAQ:GLYC) In A Good Position To Invest In Growth?Even when a business is losing money, it's possible for shareholders to make money if they buy a good business at the... |
GlycoMimetics to Participate in Upcoming Jefferies London Healthcare ConferenceROCKVILLE, Md., November 09, 2023--GlycoMimetics, Inc. (Nasdaq: GLYC) today announced that Harout Semerjian, Chief Executive Officer, will participate in a fireside chat at the Jefferies London Healthcare Conference in London, UK on Thursday, November 16, 2023 at 1:30 p.m. GMT/8:30 a.m. ET. |
GlycoMimetics, Inc. (NASDAQ:GLYC) Q3 2023 Earnings Call TranscriptGlycoMimetics, Inc. (NASDAQ:GLYC) Q3 2023 Earnings Call Transcript November 3, 2023 GlycoMimetics, Inc. reports earnings inline with expectations. Reported EPS is $-0.14 EPS, expectations were $-0.14. Operator: Good morning, and thank you for joining the GlycoMimetics Q3 2023 Earnings Call. At this time, all participants are in a listen-only mode. Following management’s remarks, we will […] |
GLYC Price Returns
| 1-mo | -13.67% |
| 3-mo | -23.00% |
| 6-mo | 70.00% |
| 1-year | 41.67% |
| 3-year | -15.33% |
| 5-year | -81.75% |
| YTD | -6.36% |
| 2023 | -22.11% |
| 2022 | 110.42% |
| 2021 | -61.70% |
| 2020 | -28.92% |
| 2019 | -44.14% |


Loading social stream, please wait...