Halozyme Therapeutics, Inc. (HALO): Price and Financial Metrics
HALO Price/Volume Stats
Current price | $38.45 | 52-week high | $59.46 |
Prev. close | $38.47 | 52-week low | $29.85 |
Day low | $38.23 | Volume | 847,869 |
Day high | $39.26 | Avg. volume | 1,262,513 |
50-day MA | $41.72 | Dividend yield | N/A |
200-day MA | $41.94 | Market Cap | 5.07B |
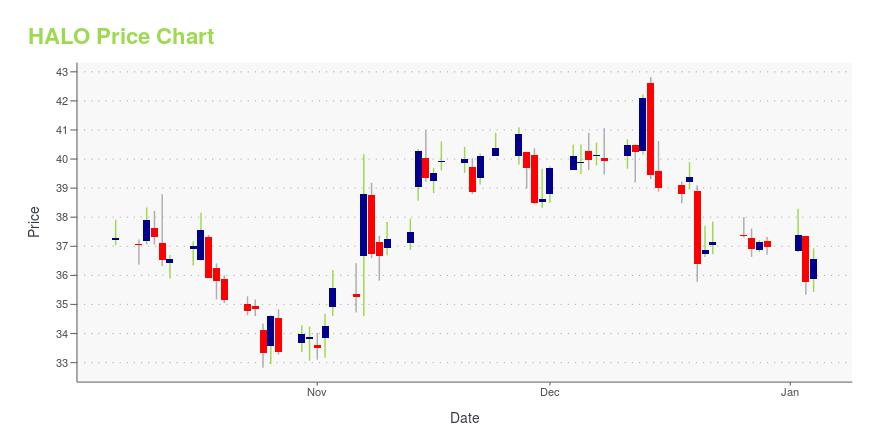
HALO Stock Price Chart Interactive Chart >
HALO POWR Grades
- HALO scores best on the Value dimension, with a Value rank ahead of 87.6% of US stocks.
- HALO's strongest trending metric is Growth; it's been moving up over the last 177 days.
- HALO ranks lowest in Momentum; there it ranks in the 3rd percentile.
HALO Stock Summary
- The capital turnover (annual revenue relative to shareholder's equity) for HALO is 5.12 -- better than 91.03% of US stocks.
- Equity multiplier, or assets relative to shareholders' equity, comes in at 14.92 for HALOZYME THERAPEUTICS INC; that's greater than it is for 95.69% of US stocks.
- As for revenue growth, note that HALO's revenue has grown 58.71% over the past 12 months; that beats the revenue growth of 90.86% of US companies in our set.
- Stocks that are quantitatively similar to HALO, based on their financial statements, market capitalization, and price volatility, are PRGS, CMTL, IPGP, VERI, and NTCT.
- HALO's SEC filings can be seen here. And to visit HALOZYME THERAPEUTICS INC's official web site, go to www.halozyme.com.
HALO Valuation Summary
- In comparison to the median Healthcare stock, HALO's price/sales ratio is 252.63% higher, now standing at 6.7.
- HALO's EV/EBIT ratio has moved up 138.5 over the prior 238 months.
Below are key valuation metrics over time for HALO.
Stock | Date | P/S | P/B | P/E | EV/EBIT |
---|---|---|---|---|---|
HALO | 2023-09-22 | 6.7 | 34.6 | 22.3 | 20.9 |
HALO | 2023-09-21 | 6.8 | 34.9 | 22.5 | 21.0 |
HALO | 2023-09-20 | 6.8 | 34.6 | 22.4 | 20.9 |
HALO | 2023-09-19 | 6.8 | 34.7 | 22.4 | 21.0 |
HALO | 2023-09-18 | 6.7 | 34.2 | 22.1 | 20.7 |
HALO | 2023-09-15 | 6.7 | 34.3 | 22.1 | 20.7 |
HALO Growth Metrics
- The 5 year price growth rate now stands at 79.34%.
- The 5 year net income to common stockholders growth rate now stands at 30.98%.
- The 2 year cash and equivalents growth rate now stands at 12.36%.

The table below shows HALO's growth in key financial areas (numbers in millions of US dollars).
Date | Revenue | Operating Cash Flow | Net Income to Common Stock |
---|---|---|---|
2022-12-31 | 660.116 | 240.11 | 202.129 |
2022-09-30 | 580.623 | 240.173 | 211.197 |
2022-06-30 | 487.477 | 292.277 | 366.15 |
2022-03-31 | 471.567 | 288.941 | 434.923 |
2021-12-31 | 443.31 | 299.44 | 402.71 |
2021-09-30 | 463.01 | 267.844 | 409.104 |
HALO's Quality Factors
The “Quality” component of the POWR Ratings focuses on 31 different factors of a companies fundamentals and operational strength. Here are some key insights as we drill into the specifics of these quality attributes.- HALO has a Quality Grade of C, ranking ahead of 73.97% of graded US stocks.
- HALO's asset turnover comes in at 0.493 -- ranking 84th of 682 Pharmaceutical Products stocks.
- ARAV, XOMA, and MGNX are the stocks whose asset turnover ratios are most correlated with HALO.
The table below shows HALO's key quality metrics over time.
Period | Asset Turnover | Gross Margin | ROIC |
---|---|---|---|
2021-09-30 | 0.493 | 0.814 | 0.250 |
2021-06-30 | 0.533 | 0.823 | 0.255 |
2021-03-31 | 0.510 | 0.832 | 0.224 |
2020-12-31 | 0.504 | 0.838 | 0.220 |
2020-09-30 | 0.378 | 0.831 | 0.053 |
2020-06-30 | 0.369 | 0.720 | -0.037 |
HALO Price Target
For more insight on analysts targets of HALO, see our HALO price target page. And for a list of of all stocks sorted by upside potential based on analyst target price, see our Top Price Target page.
Average Price Target | $52.82 | Average Broker Recommendation | 1.62 (Moderate Buy) |
Halozyme Therapeutics, Inc. (HALO) Company Bio
Halozyme Therapeutics is a biotechnology company focused on developing and commercializing novel oncology therapies that target the tumor microenvironment. The company was founded in 1998 and is based in San Diego, California.
Latest HALO News From Around the Web
Below are the latest news stories about HALOZYME THERAPEUTICS INC that investors may wish to consider to help them evaluate HALO as an investment opportunity.
7 Sleeper Stocks That Should Be on Every Investor’s Radar This FallDiscover the thrill of undervalued and overlooked sleeper stocks poised for growth in a shifting market environment. |
Insider Sell: SVP, Chief Technical Officer Michael Labarre Sells 10,000 Shares of Halozyme ...On September 19, 2023, Michael Labarre, the Senior Vice President and Chief Technical Officer of Halozyme Therapeutics Inc (NASDAQ:HALO), sold 10,000 shares of the company. |
Halozyme Therapeutics (HALO) Down 3.8% Since Last Earnings Report: Can It Rebound?Halozyme Therapeutics (HALO) reported earnings 30 days ago. What's next for the stock? We take a look at earnings estimates for some clues. |
Why Halozyme Therapeutics (HALO) is a Top Growth Stock for the Long-TermWhether you're a value, growth, or momentum investor, finding strong stocks becomes easier with the Zacks Style Scores, a top feature of the Zacks Premium research service. |
Here's Why Halozyme Therapeutics (HALO) is a Strong Value StockWhether you're a value, growth, or momentum investor, finding strong stocks becomes easier with the Zacks Style Scores, a top feature of the Zacks Premium research service. |
HALO Price Returns
1-mo | -9.40% |
3-mo | 10.90% |
6-mo | 0.68% |
1-year | -0.49% |
3-year | 47.54% |
5-year | 111.61% |
YTD | -32.43% |
2022 | 41.51% |
2021 | -5.85% |
2020 | 140.89% |
2019 | 21.19% |
2018 | -27.79% |
Continue Researching HALO
Want to see what other sources are saying about Halozyme Therapeutics Inc's financials and stock price? Try the links below:Halozyme Therapeutics Inc (HALO) Stock Price | Nasdaq
Halozyme Therapeutics Inc (HALO) Stock Quote, History and News - Yahoo Finance
Halozyme Therapeutics Inc (HALO) Stock Price and Basic Information | MarketWatch
Loading social stream, please wait...