
Humacyte, Inc. (HUMA): Price and Financial Metrics
HUMA Price/Volume Stats
| Current price | $3.81 | 52-week high | $5.60 |
| Prev. close | $3.70 | 52-week low | $1.96 |
| Day low | $3.81 | Volume | 15,786 |
| Day high | $3.81 | Avg. volume | 1,094,443 |
| 50-day MA | $3.53 | Dividend yield | N/A |
| 200-day MA | $3.09 | Market Cap | 453.71M |
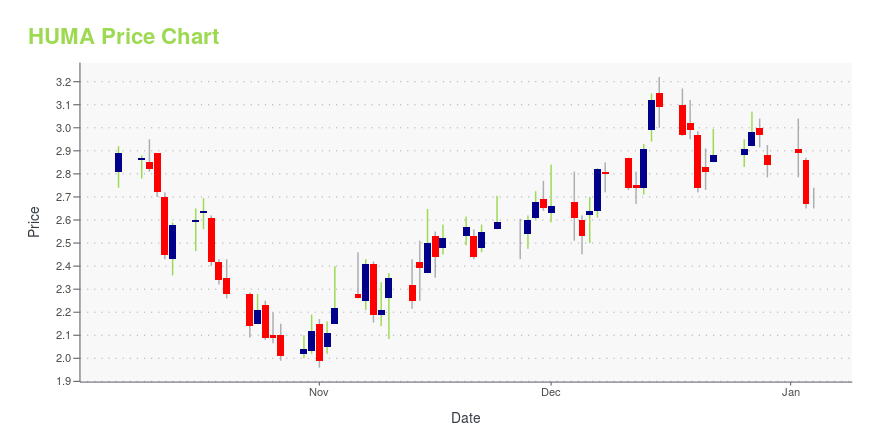
HUMA Stock Price Chart Interactive Chart >
Humacyte, Inc. (HUMA) Company Bio
Humacyte, Inc., a clinical-stage biotechnology platform company, develops and manufactures off-the-shelf bioengineered human tissues. The company develops and manufactures acellular tissues to address life- and limb-threatening vascular conditions for complex organ disease. Its Human Acellular Vessel (HAV), a regenerative vascular conduit that is in late-stage clinical trials targeting multiple vascular applications, including vascular trauma repair, arteriovenous access for hemodialysis, and peripheral arterial disease. The company was founded in 2004 and is based in Durham, North Carolina.
Latest HUMA News From Around the Web
Below are the latest news stories about HUMACYTE INC that investors may wish to consider to help them evaluate HUMA as an investment opportunity.
Humacyte Submits Biologics License Application (BLA) to U.S. FDA Seeking Approval of Human Acellular Vessel™ (HAV™) for the Treatment of Vascular Trauma– BLA supported by results from Phase 2/3 clinical trial and outcomes of real-world use of the HAV under a humanitarian aid program to treat wartime trauma injuries in Ukraine – – The HAV had higher rates of patency, and lower rates of amputation and infection, compared to historic synthetic graft benchmarks – DURHAM, N.C., Dec. 12, 2023 (GLOBE NEWSWIRE) -- Humacyte, Inc. (Nasdaq: HUMA), a clinical-stage biotechnology platform company developing universally implantable, bioengineered human tissu |
Humacyte to Present at the Piper Sandler 35th Annual Healthcare ConferenceDURHAM, N.C., Nov. 24, 2023 (GLOBE NEWSWIRE) -- Humacyte, Inc. (Nasdaq: HUMA), a clinical-stage biotechnology platform company developing universally implantable, bioengineered human tissue at commercial scale, today announced that Laura Niklason, M.D., Ph.D., Founder, President, and Chief Executive Officer, and Dale Sander, Chief Financial Officer, will present at the Piper Sandler 35th Annual Healthcare Conference, in New York, NY on November 30, 2023. Management will also be available for one |
Humacyte Announces Two Presentations at the VEITHsymposium® of Positive Clinical Results of the Human Acellular Vessel™ (HAV™) in the Treatment of Vascular Trauma– Presentations included results from Phase 2/3 clinical trial and outcomes of real-world use of the HAV under a humanitarian aid program to treat wartime injuries in Ukraine – – Results showed the HAV had higher rates of patency, and lower rates of amputation and infection, compared to historic synthetic graft benchmarks – – BLA for an indication in vascular trauma planned to be filed with the FDA during the current quarter – DURHAM, N.C., Nov. 17, 2023 (GLOBE NEWSWIRE) -- Humacyte, Inc. (Nasda |
Sidoti Events, LLC’s Virtual November Micro-Cap ConferenceNEW YORK, NY / ACCESSWIRE / November 14, 2023 / Sidoti Events, LLC, an affiliate of Sidoti & Company, LLC, has released the presentation schedule and weblinks for its two-day November Micro-Cap Conference taking place Wednesday and Thursday, November ... |
Humacyte Third Quarter 2023 Financial Results and Business Update– Positive top line results from the V005 Phase 2/3 trial of the Human Acellular Vessel™ (HAV™) in vascular trauma repair – – BLA for an indication in vascular trauma planned to be filed with the FDA during the current quarter – - Conference call and live webcast at 4:30 p.m. ET today - DURHAM, N.C., Nov. 09, 2023 (GLOBE NEWSWIRE) -- Humacyte, Inc. (Nasdaq: HUMA), a clinical-stage biotechnology platform company developing universally implantable, bioengineered human tissue at commercial scale, t |
HUMA Price Returns
| 1-mo | 15.11% |
| 3-mo | 33.22% |
| 6-mo | 82.30% |
| 1-year | 12.06% |
| 3-year | -63.15% |
| 5-year | N/A |
| YTD | 34.15% |
| 2023 | 34.60% |
| 2022 | -70.90% |
| 2021 | -28.71% |
| 2020 | N/A |
| 2019 | N/A |
Loading social stream, please wait...