
Inhibrx Inc. (INBX): Price and Financial Metrics
INBX Price/Volume Stats
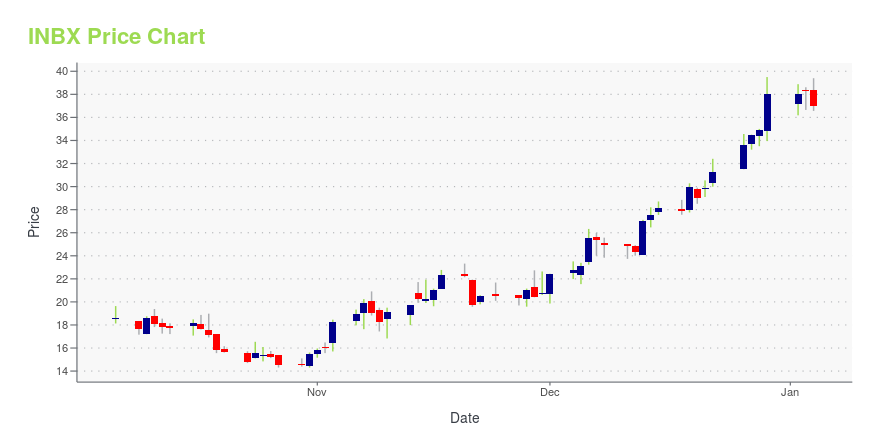
| Current price | $34.61 | 52-week high | $39.79 |
| Prev. close | $34.74 | 52-week low | $14.31 |
| Day low | $34.59 | Volume | 208,900 |
| Day high | $34.90 | Avg. volume | 706,145 |
| 50-day MA | $36.13 | Dividend yield | N/A |
| 200-day MA | $26.69 | Market Cap | 1.64B |
INBX Stock Price Chart Interactive Chart >
Inhibrx Inc. (INBX) Company Bio
Inhibrx is a clinical-stage biotechnology company focused on developing a broad pipeline of novel biologic therapeutic candidates. Inhibrx utilizes diverse methods of protein engineering to address the specific requirements of complex target and disease biology, including its proprietary sdAb platform. The Inhibrx pipeline is focused on oncology, orphan diseases and infectious diseases. Inhibrx has collaborations with Celgene and bluebird bio and has received awards from several granting agencies, including NIH, NIAID and CARB-X.
Latest INBX News From Around the Web
Below are the latest news stories about INHIBRX INC that investors may wish to consider to help them evaluate INBX as an investment opportunity.
Inhibrx Reports Third Quarter 2023 Financial Results and Recent Corporate HighlightsInhibrx, Inc. (Nasdaq: INBX), or Inhibrx, or the Company, a biopharmaceutical company with four programs in ongoing clinical trials and a strong emerging pipeline, today reported financial results for the third quarter of 2023 and provided an update on recent corporate highlights. |
Inhibrx Announces Preliminary Data from the Phase 1 Trial of INBRX-109 for the Treatment of Ewing SarcomaInhibrx, Inc. (Nasdaq: INBX), a clinical-stage biopharmaceutical company dedicated to the development of therapeutics for oncology and rare diseases, today announced preliminary efficacy and safety data from the Phase 1 trial of INBRX-109 in combination with Irinotecan and Temozolomide (IRI/TMZ) for the treatment of advanced or metastatic, unresectable Ewing sarcoma. Inhibrx presented this dataset as of the data cut of September 8th, 2023 at the Annual Connective Tissue Oncology Society (CTOS) C |
Inhibrx Announces Participation in Upcoming Scientific ConferencesInhibrx, Inc. (Nasdaq: INBX), a clinical-stage biopharmaceutical company dedicated to the development of therapeutics for oncology and rare diseases, today announced it will be presenting at the following upcoming scientific conferences: |
Inhibrx Retains Rights to INBRX-101 for the Treatment of Alpha-1 Antitrypsin Deficiency Outside of the United States and CanadaInhibrx, Inc. (Nasdaq: INBX), a clinical-stage biopharmaceutical company dedicated to the development of therapeutics for oncology and rare diseases, announced today that Chiesi Farmaceutici S.p.A ("Chiesi") declined to exercise its option for the ex-North American rights to develop and commercialize INBRX-101 for the treatment of patients with emphysema due to Alpha-1 Antitrypsin Deficiency ("AATD"). |
12 Best High Risk High Reward Stocks To Buy NowIn this piece, we will take a look at the 12 best high risk high reward stocks to buy now. If you want to skip our background on investing, then head on over to 5 Best High Risk High Reward Stocks To Buy Now. Investing is a risky endeavor, as is anything that involves the […] |
INBX Price Returns
| 1-mo | -1.11% |
| 3-mo | 3.87% |
| 6-mo | 118.91% |
| 1-year | 73.74% |
| 3-year | 91.96% |
| 5-year | N/A |
| YTD | -8.92% |
| 2023 | 54.22% |
| 2022 | -43.58% |
| 2021 | 32.45% |
| 2020 | N/A |
| 2019 | N/A |
Loading social stream, please wait...