Kinsale Capital Group, Inc. (KNSL): Price and Financial Metrics


Kinsale Capital Group, Inc. (KNSL): $290.41

8.50 (+3.02%)

POWR Rating

Component Grades

Growth

S

Value

I

Momentum

G

Stability

N

Sentiment

U

Quality

P

KNSL POWR Grades

  • Momentum is the dimension where KNSL ranks best; there it ranks ahead of 86.91% of US stocks.
  • The strongest trend for KNSL is in Stability, which has been heading down over the past 178 days.
  • KNSL's current lowest rank is in the Value metric (where it is better than 1.81% of US stocks).

KNSL Stock Summary

  • KNSL's one year PEG ratio, measuring expected growth in earnings next year relative to current common stock price is 699.39 -- higher than 95.82% of US-listed equities with positive expected earnings growth.
  • KNSL's price/sales ratio is 7.95; that's higher than the P/S ratio of 86.02% of US stocks.
  • With a year-over-year growth in debt of 358.47%, KINSALE CAPITAL GROUP INC's debt growth rate surpasses 95.47% of about US stocks.
  • Stocks that are quantitatively similar to KNSL, based on their financial statements, market capitalization, and price volatility, are GIII, BMI, PKE, FLS, and ADUS.
  • KNSL's SEC filings can be seen here. And to visit KINSALE CAPITAL GROUP INC's official web site, go to www.kinsalecapitalgroup.com.

KNSL Valuation Summary

  • KNSL's price/earnings ratio is 40.9; this is 330.53% higher than that of the median Financial Services stock.
  • Over the past 81 months, KNSL's price/earnings ratio has gone up 23.6.

Below are key valuation metrics over time for KNSL.

Stock Date P/S P/B P/E EV/EBIT
KNSL 2023-03-17 7.9 8.7 40.9 32.8
KNSL 2023-03-16 8.4 9.3 43.4 34.7
KNSL 2023-03-15 8.1 8.9 41.8 33.5
KNSL 2023-03-14 8.3 9.1 42.9 34.3
KNSL 2023-03-13 8.1 8.9 41.8 33.5
KNSL 2023-03-10 8.3 9.1 42.7 34.2

KNSL Growth Metrics

    Its year over year cash and equivalents growth rate is now at -21.41%.
  • The 2 year net income to common stockholders growth rate now stands at 206.69%.
  • The 3 year net cashflow from operations growth rate now stands at 276.16%.
Over the past 33 months, KNSL's revenue has gone up $443,950,000.

The table below shows KNSL's growth in key financial areas (numbers in millions of US dollars).

Date Revenue Operating Cash Flow Net Income to Common Stock
2022-09-30 759.838 561.86 140.185
2022-06-30 707.761 490.748 143.826
2022-03-31 681.814 437.649 152.371
2021-12-31 639.779 407.042 152.659
2021-09-30 595.509 375.394 142.52
2021-06-30 553.126 342.335 120.785

KNSL's Quality Factors

The “Quality” component of the POWR Ratings focuses on 31 different factors of a companies fundamentals and operational strength. Here are some key insights as we drill into the specifics of these quality attributes.
  • KNSL has a Quality Grade of C, ranking ahead of 70.89% of graded US stocks.
  • KNSL's asset turnover comes in at 0.345 -- ranking 47th of 133 Insurance stocks.
  • ACGL, Y, and ALL are the stocks whose asset turnover ratios are most correlated with KNSL.

The table below shows KNSL's key quality metrics over time.

Period Asset Turnover Gross Margin ROIC
2021-09-30 0.345 0.486 0.104
2021-06-30 0.342 0.456 0.092
2021-03-31 0.348 0.459 0.094
2020-12-31 0.336 0.426 0.075
2020-09-30 0.330 0.405 0.066
2020-06-30 0.322 0.436 0.072

KNSL Price Target

For more insight on analysts targets of KNSL, see our KNSL price target page. And for a list of of all stocks sorted by upside potential based on analyst target price, see our Top Price Target page.

Average Price Target $213.75 Average Broker Recommendation 1.71 (Moderate Buy)

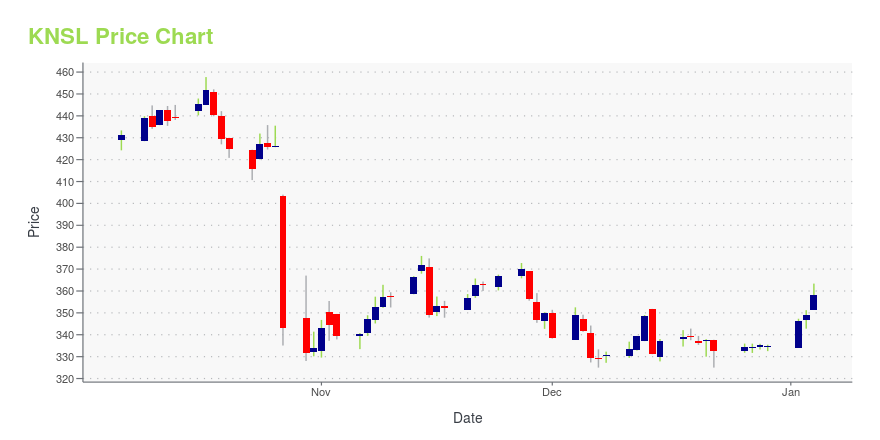
KNSL Stock Price Chart Interactive Chart >

Price chart for KNSL

KNSL Price/Volume Stats

Current price $290.41 52-week high $337.11
Prev. close $281.91 52-week low $196.00
Day low $283.41 Volume 70,500
Day high $292.60 Avg. volume 171,977
50-day MA $294.35 Dividend yield 0.19%
200-day MA $270.18 Market Cap 6.71B

Kinsale Capital Group, Inc. (KNSL) Company Bio


Kinsale Holdings, doing business as Validant, offers regulatory and strategic consulting services. The company provides technical and product transfer, packaging and labeling, supplier audit and qualification, equipment and instrument qualification, methods validation, and facilities management services. Additionally, it offers stability program assessment, design control, quality audit, pre-product assessment, and remediation planning services. The company caters to biotechnology, pharmaceutical, and medical device sectors. Kinsale Holdings, Inc. was founded in 2005 and is based in San Francisco, California.


KNSL Latest News Stream


Event/Time News Detail
Loading, please wait...

KNSL Latest Social Stream


Loading social stream, please wait...

View Full KNSL Social Stream

Latest KNSL News From Around the Web

Below are the latest news stories about KINSALE CAPITAL GROUP INC that investors may wish to consider to help them evaluate KNSL as an investment opportunity.

3 Reasons Why Growth Investors Shouldn't Overlook Kinsale Capital Group, Inc. (KNSL)

Kinsale Capital Group, Inc. (KNSL) is well positioned to outperform the market, as it exhibits above-average growth in financials.

Yahoo | March 13, 2023

Kinsale Announces Promotions

RICHMOND, Va., March 06, 2023--Kinsale Announces Promotions

Yahoo | March 6, 2023

Kinsale Capital Group, Inc. Reports 2022 Fourth Quarter and Year-End Results

RICHMOND, Va., February 16, 2023--Kinsale Capital Group, Inc. Reports 2022 Fourth Quarter and Year-End Results

Yahoo | February 16, 2023

Kinsale Capital Group Announces Dividend Declaration

RICHMOND, Va., February 15, 2023--Kinsale Capital Group Announces Dividend Declaration

Yahoo | February 15, 2023

Will Kinsale Capital Group, Inc. (KNSL) Beat Estimates Again in Its Next Earnings Report?

Kinsale Capital Group, Inc. (KNSL) has an impressive earnings surprise history and currently possesses the right combination of the two key ingredients for a likely beat in its next quarterly report.

Yahoo | February 7, 2023

Read More 'KNSL' Stories Here

KNSL Price Returns

1-mo -13.09%
3-mo 3.48%
6-mo 15.40%
1-year 28.11%
3-year 238.40%
5-year 463.39%
YTD 11.10%
2022 10.17%
2021 19.16%
2020 97.28%
2019 83.67%
2018 24.09%

KNSL Dividends

Ex-Dividend Date Type Payout Amount Change
Loading, please wait...
View Full KNSL Dividend History

Continue Researching KNSL

Want to see what other sources are saying about Kinsale Capital Group Inc's financials and stock price? Try the links below:

Kinsale Capital Group Inc (KNSL) Stock Price | Nasdaq
Kinsale Capital Group Inc (KNSL) Stock Quote, History and News - Yahoo Finance
Kinsale Capital Group Inc (KNSL) Stock Price and Basic Information | MarketWatch

Get Free Updates

Join thousands of investors who get the latest news, insights and top rated picks from StockNews.com!


Page generated in 0.8091 seconds.