
Landmark Bancorp Inc. (LARK): Price and Financial Metrics
LARK Price/Volume Stats
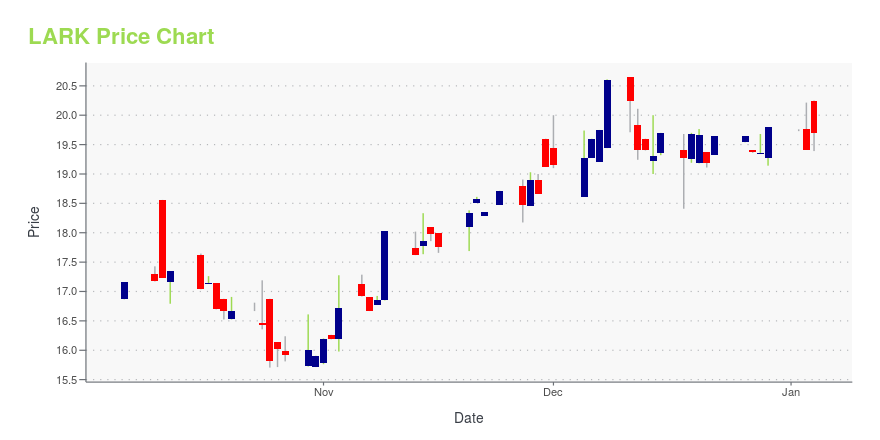
| Current price | $19.19 | 52-week high | $21.78 |
| Prev. close | $19.23 | 52-week low | $15.70 |
| Day low | $18.76 | Volume | 4,876 |
| Day high | $19.25 | Avg. volume | 3,448 |
| 50-day MA | $19.50 | Dividend yield | 4.42% |
| 200-day MA | $19.07 | Market Cap | 105.05M |
LARK Stock Price Chart Interactive Chart >
Landmark Bancorp Inc. (LARK) Company Bio
Landmark Bancorp, Inc. operates as the bank holding company for Landmark National Bank that provides various banking products and services in Kansas. The company was founded in 1920 and is based in Manhattan, Kansas.
Latest LARK News From Around the Web
Below are the latest news stories about LANDMARK BANCORP INC that investors may wish to consider to help them evaluate LARK as an investment opportunity.
Is It Smart To Buy Landmark Bancorp, Inc. (NASDAQ:LARK) Before It Goes Ex-Dividend?Readers hoping to buy Landmark Bancorp, Inc. ( NASDAQ:LARK ) for its dividend will need to make their move shortly, as... |
Landmark Bancorp (NASDAQ:LARK) Will Pay A Dividend Of $0.21The board of Landmark Bancorp, Inc. ( NASDAQ:LARK ) has announced that it will pay a dividend of $0.21 per share on the... |
Landmark Bancorp, Inc. (NASDAQ:LARK) Q3 2023 Earnings Call TranscriptLandmark Bancorp, Inc. (NASDAQ:LARK) Q3 2023 Earnings Call Transcript November 1, 2023 Operator: Good morning, everyone, and welcome to today’s conference call titled Landmark Bancorp Third Quarter Earnings Call. My name is Ellen, and I’ll be the call operator today. [Operator Instructions] I’d now like to turn the call over to Michael Scheopner, CEO, to […] |
Landmark Bancorp Inc (LARK) Reports Q3 Earnings Per Share of $0.55, Declares Cash Dividend of $0.21Net earnings for Q3 2023 amount to $2.9 million, marking a steady year-over-year growth |
Landmark Bancorp, Inc. Announces Third Quarter Earnings Per Share of $0.55. Declares Cash Dividend of $0.21 per Share and 5% Stock DividendManhattan, KS, Oct. 31, 2023 (GLOBE NEWSWIRE) -- Landmark Bancorp, Inc. (“Landmark”; Nasdaq: LARK) reported diluted earnings per share of $0.55 for the three months ended September 30, 2023, compared to $0.64 per share in the second quarter of 2023 and $0.48 per share in the same quarter last year. Net earnings for the third quarter of 2023 amounted to $2.9 million, compared to $3.4 million in the prior quarter and $2.5 million for the third quarter of 2022. For the three months ended September |
LARK Price Returns
| 1-mo | 0.73% |
| 3-mo | -10.97% |
| 6-mo | 23.17% |
| 1-year | 3.19% |
| 3-year | -2.93% |
| 5-year | 12.99% |
| YTD | -2.04% |
| 2023 | -4.29% |
| 2022 | -14.47% |
| 2021 | 35.73% |
| 2020 | -0.98% |
| 2019 | 11.64% |
LARK Dividends
| Ex-Dividend Date | Type | Payout Amount | Change | ||||||
|---|---|---|---|---|---|---|---|---|---|
| Loading, please wait... | |||||||||
Continue Researching LARK
Want to see what other sources are saying about Landmark Bancorp Inc's financials and stock price? Try the links below:Landmark Bancorp Inc (LARK) Stock Price | Nasdaq
Landmark Bancorp Inc (LARK) Stock Quote, History and News - Yahoo Finance
Landmark Bancorp Inc (LARK) Stock Price and Basic Information | MarketWatch
Loading social stream, please wait...