
Merchants Bancorp (MBIN): Price and Financial Metrics
MBIN Price/Volume Stats
| Current price | $38.44 | 52-week high | $48.68 |
| Prev. close | $37.63 | 52-week low | $21.50 |
| Day low | $37.63 | Volume | 149,600 |
| Day high | $38.74 | Avg. volume | 120,847 |
| 50-day MA | $41.24 | Dividend yield | 0.94% |
| 200-day MA | $34.87 | Market Cap | 1.67B |
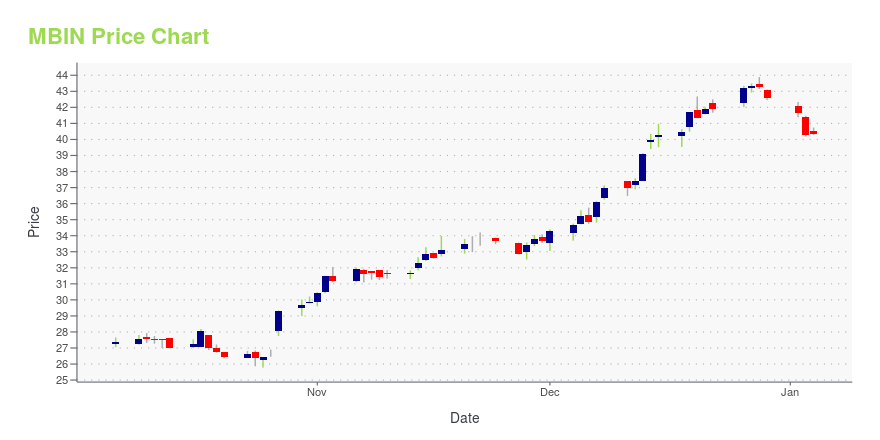
MBIN Stock Price Chart Interactive Chart >
Merchants Bancorp (MBIN) Company Bio
Merchants Bancorp is a diversified bank holding company based in Carmel, Indiana operating multiple lines of business with a focus on Federal Housing Administration ("FHA") multi-family housing and healthcare facility financing and servicing, mortgage warehouse financing, retail and correspondent residential mortgage banking, agricultural lending and traditional community banking. The company was founded in 1923
Latest MBIN News From Around the Web
Below are the latest news stories about MERCHANTS BANCORP that investors may wish to consider to help them evaluate MBIN as an investment opportunity.
Zacks.com featured highlights include Arcos Dorados Holdings, Ponce Financial Group, InterDigital, Limbach Holdings and Merchants BancorpArcos Dorados Holdings, Ponce Financial Group, InterDigital, Limbach Holdings and Merchants Bancorp are part of the Zacks Screen of the Week article. |
Zacks.com featured highlights include Perdoceo Education, Novo Nordisk and Merchants BancorpPerdoceo Education, Novo Nordisk and Merchants Bancorp are part of the Zacks Screen of the Week article. |
5 Stocks With Recent Price Strength for Sparkling ReturnsInvestors target stocks that are witnessing a bullish run. Some of the stocks seeing price strength are ARCO, PDLB, IDCC, LMB, MBIN. |
Merchants Bancorp (NASDAQ:MBIN) Has Announced A Dividend Of $0.08Merchants Bancorp's ( NASDAQ:MBIN ) investors are due to receive a payment of $0.08 per share on 2nd of January. The... |
3 Best Profitable Stocks to Invest in Using Net Income RatioPerdoceo Education (PRDO), Novo Nordisk (NVO) and Merchants Bancorp (MBIN) have been selected as the top picks with a high net income ratio. |
MBIN Price Returns
| 1-mo | -9.53% |
| 3-mo | -6.88% |
| 6-mo | 45.94% |
| 1-year | 55.06% |
| 3-year | 133.36% |
| 5-year | 286.67% |
| YTD | -9.53% |
| 2023 | 77.01% |
| 2022 | 16.91% |
| 2021 | 72.68% |
| 2020 | 42.55% |
| 2019 | 0.30% |
MBIN Dividends
| Ex-Dividend Date | Type | Payout Amount | Change | ||||||
|---|---|---|---|---|---|---|---|---|---|
| Loading, please wait... | |||||||||
Continue Researching MBIN
Want to see what other sources are saying about Merchants Bancorp's financials and stock price? Try the links below:Merchants Bancorp (MBIN) Stock Price | Nasdaq
Merchants Bancorp (MBIN) Stock Quote, History and News - Yahoo Finance
Merchants Bancorp (MBIN) Stock Price and Basic Information | MarketWatch
Loading social stream, please wait...