
Mobileye Global Inc. (MBLY): Price and Financial Metrics
MBLY Price/Volume Stats
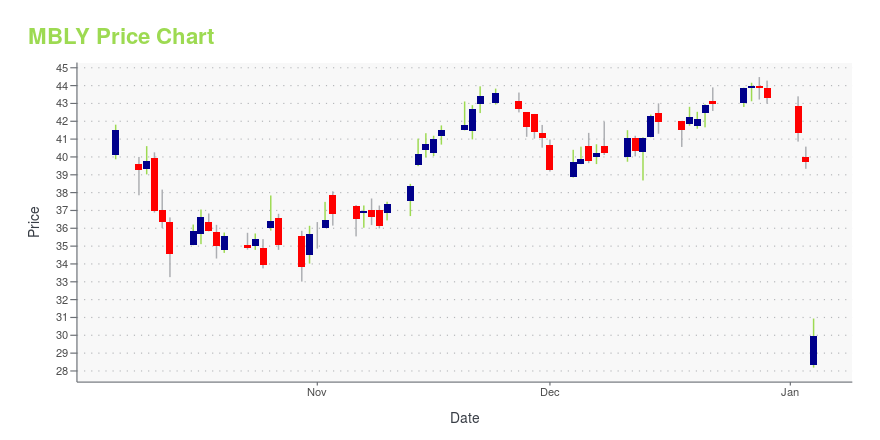
| Current price | $30.92 | 52-week high | $47.41 |
| Prev. close | $30.98 | 52-week low | $23.49 |
| Day low | $30.67 | Volume | 157,195 |
| Day high | $31.17 | Avg. volume | 4,650,002 |
| 50-day MA | $28.77 | Dividend yield | N/A |
| 200-day MA | $35.14 | Market Cap | 24.93B |
MBLY Stock Price Chart Interactive Chart >
Latest MBLY News From Around the Web
Below are the latest news stories about MOBILEYE GLOBAL INC that investors may wish to consider to help them evaluate MBLY as an investment opportunity.
13 Best IPO Stocks to Buy Heading into 2024In this article, we will take a look at the 13 best IPO stocks to buy heading into 2024. To skip our analysis of the recent market trends and market activity, you can go directly to see the 5 Best IPO Stocks to Buy Heading into 2024. The global equity markets had one of their […] |
Mobileye Announces CES 2024 Press Conference with Prof. Amnon ShashuaJERUSALEM, December 20, 2023--Mobileye (Nasdaq: MBLY) will present its 2024 CES Press Conference, Mobileye: Now. Next. Beyond. with President & CEO Prof. Amnon Shashua, on January 9, 2024, at 11:00 a.m. PT. |
Mobileye Global (MBLY) Outperforms Broader Market: What You Need to KnowThe latest trading day saw Mobileye Global (MBLY) settling at $42.22, representing a +1.76% change from its previous close. |
Are November’s 3 Biggest Stock Losers Worth Snapping Up Now?The market was like an iceberg with only a few winners showing but that means there are a lot of the biggest stock losers worth getting now. |
Mobileye Global (MBLY) Stock Declines While Market Improves: Some Information for InvestorsMobileye Global (MBLY) reachead $40.35 at the closing of the latest trading day, reflecting a -1.75% change compared to its last close. |
MBLY Price Returns
| 1-mo | 1.38% |
| 3-mo | 9.10% |
| 6-mo | -13.02% |
| 1-year | -30.58% |
| 3-year | N/A |
| 5-year | N/A |
| YTD | -28.62% |
| 2023 | 23.56% |
| 2022 | N/A |
| 2021 | N/A |
| 2020 | N/A |
| 2019 | N/A |
Loading social stream, please wait...