
MDC Partners Inc. - Class A Subordinate Voting Shares (MDCA): Price and Financial Metrics
MDCA Price/Volume Stats
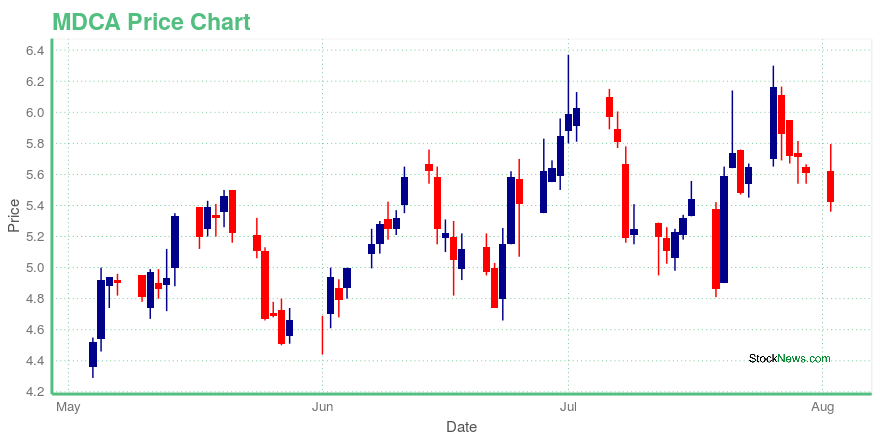
| Current price | $5.42 | 52-week high | $6.37 |
| Prev. close | $5.61 | 52-week low | $1.60 |
| Day low | $5.36 | Volume | 154,300 |
| Day high | $5.80 | Avg. volume | 274,618 |
| 50-day MA | $5.33 | Dividend yield | N/A |
| 200-day MA | $3.63 | Market Cap | 418.34M |
MDCA Stock Price Chart Interactive Chart >
MDC Partners Inc. - Class A Subordinate Voting Shares (MDCA) Company Bio
MDC Partners provides marketing, activation and communications, and consulting solutions and services worldwide. It operates through two segments, Strategic Marketing Services and Performance Marketing Services. The company was founded in 1980 and is based in New York, New York.
Latest MDCA News From Around the Web
Below are the latest news stories about Mdc Partners Inc that investors may wish to consider to help them evaluate MDCA as an investment opportunity.
MDC Partners Inc. (MDCA) and Stagwell Marketing Group LLC Schedule Conference Call to Discuss Financial Results for the Three Months Ended June 30, 2021(NASDAQ: MDCA) – MDC Partners Inc. ("MDC Partners" or the "Company") and Stagwell Marketing Group LLC ("Stagwell") announced today that both companies will report separate financial results for the three months ending June 30, 2021 on Wednesday, August 4, 2021, before market open. |
MDC Partners Inc. Announces Amendments and Waivers to Notes are OperativeMDC Partners Inc. (the "Issuer") announced today that the amendments and waivers set out in the third supplemental indenture dated February 8, 2021 (the "Third Supplemental Indenture") in respect of its its 7.500% Senior Notes due 2024, CUSIP C5429X AJ5 (Regulation S) and 552697 AQ7 (Rule 144A) (the "Notes") are operative with immediate effect. |
MDC Partners' Shareholders Ratify Stagwell MergerMDC Partners Inc's (NASDAQ: MDCA) shareholders voted to approve the previously announced business combination of MDC with certain subsidiaries of Stagwell Media LP during a special meeting held earlier today. The combined company will be renamed Stagwell Inc and will trade on the Nasdaq. It was a unique opportunity to create a new marketing machine that can transform the industry and create enhanced opportunities for growth and value in the marketplace, MDC Partners CEO Mark Penn stated. Stagwel |
MDC Partners (MDCA) Shareholders Approve Business Combination with Stagwell(NASDAQ: MDCA) – MDC Partners Inc. ("MDC Partners", "MDC" or the "Company") announced today that MDC shareholders voted to approve the previously announced business combination (the "Transaction") of MDC with certain subsidiaries of Stagwell Media LP ("Stagwell"), during a special meeting of shareholders held earlier today. Following the close of the Transaction, the combined company will be renamed Stagwell Inc, and will be traded on the NASDAQ Stock Exchange. The Company currently anticipates |
Independent Proxy Advisory Firm Glass Lewis Joins ISS In Recommending MDC Partners (MDCA) Shareholders Vote "For" The Amended Transaction With Stagwell(NASDAQ: MDCA) – MDC Partners Inc. ("MDC Partners", "MDC" or the "Company") announced today that independent proxy advisory firm Glass Lewis & Co. ("Glass Lewis") has joined Institutional Shareholder Services ("ISS") in recommending that MDC shareholders vote FOR the proposal to approve the combination of MDC with certain subsidiaries of Stagwell Media LP ("Stagwell"), at the Company's Special Meeting of Shareholders, scheduled to be held on July 26, 2021. |
MDCA Price Returns
| 1-mo | N/A |
| 3-mo | N/A |
| 6-mo | N/A |
| 1-year | N/A |
| 3-year | 34.49% |
| 5-year | 165.69% |
| YTD | N/A |
| 2023 | N/A |
| 2022 | N/A |
| 2021 | 0.00% |
| 2020 | -9.71% |
| 2019 | 6.51% |
Continue Researching MDCA
Want to do more research on Mdc Partners Inc's stock and its price? Try the links below:Mdc Partners Inc (MDCA) Stock Price | Nasdaq
Mdc Partners Inc (MDCA) Stock Quote, History and News - Yahoo Finance
Mdc Partners Inc (MDCA) Stock Price and Basic Information | MarketWatch
Loading social stream, please wait...