MannKind Corporation (MNKD): Price and Financial Metrics
MNKD Price/Volume Stats
Current price | $3.71 | 52-week high | $5.75 |
Prev. close | $3.75 | 52-week low | $3.38 |
Day low | $3.64 | Volume | 2,574,700 |
Day high | $3.79 | Avg. volume | 2,899,198 |
50-day MA | $3.89 | Dividend yield | N/A |
200-day MA | $4.25 | Market Cap | 1.00B |
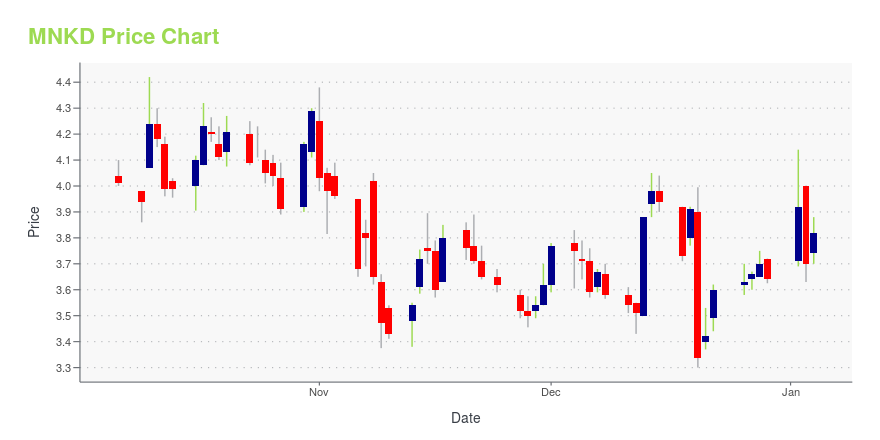
MNKD Stock Price Chart Interactive Chart >
MNKD POWR Grades
- MNKD scores best on the Growth dimension, with a Growth rank ahead of 96.52% of US stocks.
- The strongest trend for MNKD is in Quality, which has been heading down over the past 177 days.
- MNKD's current lowest rank is in the Momentum metric (where it is better than 15.96% of US stocks).
MNKD Stock Summary
- The price/operating cash flow metric for MANNKIND CORP is higher than 97.31% of stocks in our set with a positive cash flow.
- MNKD's equity multiplier -- a measure of assets relative to shareholders'equity -- is greater than that of merely 5.96% of US stocks.
- As for revenue growth, note that MNKD's revenue has grown 131.61% over the past 12 months; that beats the revenue growth of 96.09% of US companies in our set.
- If you're looking for stocks that are quantitatively similar to MANNKIND CORP, a group of peers worth examining would be DVAX, EVLV, EVBG, LNSR, and EOSE.
- Visit MNKD's SEC page to see the company's official filings. To visit the company's web site, go to www.mannkindcorp.com.
MNKD Valuation Summary
- In comparison to the median Healthcare stock, MNKD's price/sales ratio is 208.11% higher, now standing at 5.7.
- Over the past 235 months, MNKD's price/sales ratio has gone NA NA.
Below are key valuation metrics over time for MNKD.
Stock | Date | P/S | P/B | P/E | EV/EBIT |
---|---|---|---|---|---|
MNKD | 2023-11-20 | 5.7 | -4.0 | -32.4 | -211.9 |
MNKD | 2023-11-17 | 5.8 | -4.1 | -32.7 | -213.6 |
MNKD | 2023-11-16 | 5.5 | -3.9 | -31.0 | -204.9 |
MNKD | 2023-11-15 | 5.7 | -4.0 | -32.3 | -211.4 |
MNKD | 2023-11-14 | 5.7 | -4.0 | -32.1 | -210.1 |
MNKD | 2023-11-13 | 5.4 | -3.8 | -30.5 | -202.3 |
MNKD Growth Metrics
- Its 2 year net income to common stockholders growth rate is now at -102.86%.
- Its 3 year cash and equivalents growth rate is now at 91.81%.
- Its year over year price growth rate is now at -23.63%.

The table below shows MNKD's growth in key financial areas (numbers in millions of US dollars).
Date | Revenue | Operating Cash Flow | Net Income to Common Stock |
---|---|---|---|
2022-09-30 | 76.226 | -90.65 | -97.514 |
2022-06-30 | 65.612 | -77.761 | -87.508 |
2022-03-31 | 69.998 | -67.226 | -94.008 |
2021-12-31 | 75.442 | -61.709 | -80.926 |
2021-09-30 | 81.37 | -49.127 | -79.276 |
2021-06-30 | 74.511 | -47.403 | -86.105 |
MNKD's Quality Factors
The “Quality” component of the POWR Ratings focuses on 31 different factors of a companies fundamentals and operational strength. Here are some key insights as we drill into the specifics of these quality attributes.- MNKD has a Quality Grade of C, ranking ahead of 42.97% of graded US stocks.
- MNKD's asset turnover comes in at 0.384 -- ranking 124th of 680 Pharmaceutical Products stocks.
- VERU, PLX, and LGND are the stocks whose asset turnover ratios are most correlated with MNKD.
The table below shows MNKD's key quality metrics over time.
Period | Asset Turnover | Gross Margin | ROIC |
---|---|---|---|
2021-06-30 | 0.384 | 0.611 | -0.321 |
2021-03-31 | 0.424 | 0.627 | -0.330 |
2020-12-31 | 0.673 | 0.622 | -0.564 |
2020-09-30 | 0.673 | 0.595 | -0.391 |
2020-06-30 | 0.666 | 0.529 | -0.297 |
2020-03-31 | 0.705 | 0.516 | -0.324 |
MNKD Price Target
For more insight on analysts targets of MNKD, see our MNKD price target page. And for a list of of all stocks sorted by upside potential based on analyst target price, see our Top Price Target page.
Average Price Target | $6.17 | Average Broker Recommendation | 1.33 (Strong Buy) |
MannKind Corporation (MNKD) Company Bio
MannKind Corporation focuses on the discovery, development, and commercialization of therapeutic products for diabetes in the United States. The company was founded in 1991 and is based in Valencia, California.
Latest MNKD News From Around the Web
Below are the latest news stories about MANNKIND CORP that investors may wish to consider to help them evaluate MNKD as an investment opportunity.
Investors in MannKind (NASDAQ:MNKD) have seen solid returns of 115% over the past five yearsIt hasn't been the best quarter for MannKind Corporation ( NASDAQ:MNKD ) shareholders, since the share price has fallen... |
MannKind Corporation (NASDAQ:MNKD) Q3 2023 Earnings Call TranscriptMannKind Corporation (NASDAQ:MNKD) Q3 2023 Earnings Call Transcript November 7, 2023 MannKind Corporation beats earnings expectations. Reported EPS is $0.01, expectations were $-0.02. Operator: Good afternoon and welcome to the MannKind Corporation 2023 Third Quarter Financial Results Earnings Call. As a reminder, this call is being recorded on November 7th, 2023, and will be available […] |
MannKind (MNKD) Q3 2023 Earnings Call TranscriptAs a reminder, this call is being recorded on November 7, 2023, and will be available for playback on the MannKind Corporation website shortly after the conclusion of this call until November 21, 2023. Joining us today from MannKind are Chief Executive Officer Michael Castagna and Chief Financial Officer Steven Binder. |
MannKind (MNKD) Reports Q3 Earnings: What Key Metrics Have to SayWhile the top- and bottom-line numbers for MannKind (MNKD) give a sense of how the business performed in the quarter ended September 2023, it could be worth looking at how some of its key metrics compare to Wall Street estimates and year-ago values. |
MannKind Corporation Reports 2023 Third Quarter Financial ResultsConference Call to Begin Today at 5:00 p.m. (ET) 3Q 2023 Total revenues of $51M; +56% vs. 3Q 20223Q YTD 2023 Total revenues of $140M; +121% vs. 3Q YTD 20223Q 2023 Net income of $2M; Non-GAAP net income of $4M3Q 2023 Tyvaso DPI royalties of $20M; +225% vs. 3Q 20223Q 2023 Endocrine BU net revenues of $18M; Afrezza net revenues +24% vs. 3Q 2022 DANBURY, Conn. and WESTLAKE VILLAGE, Calif., Nov. 07, 2023 (GLOBE NEWSWIRE) -- MannKind Corporation (Nasdaq: MNKD) today reported financial results for the |
MNKD Price Returns
1-mo | 0.82% |
3-mo | -15.49% |
6-mo | -7.94% |
1-year | -18.82% |
3-year | 25.76% |
5-year | 112.00% |
YTD | -29.60% |
2022 | 20.59% |
2021 | 39.62% |
2020 | 142.64% |
2019 | 21.70% |
2018 | -54.31% |
Continue Researching MNKD
Want to do more research on Mannkind Corp's stock and its price? Try the links below:Mannkind Corp (MNKD) Stock Price | Nasdaq
Mannkind Corp (MNKD) Stock Quote, History and News - Yahoo Finance
Mannkind Corp (MNKD) Stock Price and Basic Information | MarketWatch
Loading social stream, please wait...