Invitae Corporation (NVTA): Price and Financial Metrics
GET POWR RATINGS... FREE!
NVTA POWR Grades
- Growth is the dimension where NVTA ranks best; there it ranks ahead of 89.96% of US stocks.
- The strongest trend for NVTA is in Momentum, which has been heading down over the past 177 days.
- NVTA ranks lowest in Stability; there it ranks in the 6th percentile.
NVTA Stock Summary
- Of note is the ratio of INVITAE CORP's sales and general administrative expense to its total operating expenses; merely 5.04% of US stocks have a lower such ratio.
- In terms of twelve month growth in earnings before interest and taxes, INVITAE CORP is reporting a growth rate of 542.4%; that's higher than 96.81% of US stocks.
- In terms of volatility of its share price, NVTA is more volatile than 87.08% of stocks we're observing.
- Stocks that are quantitatively similar to NVTA, based on their financial statements, market capitalization, and price volatility, are KN, MUR, SSRM, RIOT, and KOS.
- Visit NVTA's SEC page to see the company's official filings. To visit the company's web site, go to www.invitae.com.
NVTA Valuation Summary
- In comparison to the median Healthcare stock, NVTA's price/earnings ratio is 100.88% lower, now standing at -0.2.
- NVTA's price/earnings ratio has moved up 20.1 over the prior 97 months.
Below are key valuation metrics over time for NVTA.
Stock | Date | P/S | P/B | P/E | EV/EBIT |
---|---|---|---|---|---|
NVTA | 2023-01-20 | 1.2 | 3.9 | -0.2 | -0.7 |
NVTA | 2023-01-19 | 1.1 | 3.7 | -0.2 | -0.7 |
NVTA | 2023-01-18 | 1.2 | 3.9 | -0.2 | -0.7 |
NVTA | 2023-01-17 | 1.2 | 4.0 | -0.2 | -0.7 |
NVTA | 2023-01-13 | 1.2 | 3.8 | -0.2 | -0.7 |
NVTA | 2023-01-12 | 1.1 | 3.6 | -0.2 | -0.7 |
NVTA Growth Metrics
- Its 3 year revenue growth rate is now at 199.24%.
- Its 3 year net cashflow from operations growth rate is now at -604.62%.
- Its 2 year price growth rate is now at -68.8%.

The table below shows NVTA's growth in key financial areas (numbers in millions of US dollars).
Date | Revenue | Operating Cash Flow | Net Income to Common Stock |
---|---|---|---|
2022-09-30 | 519.97 | -586.852 | -3,211.6 |
2022-06-30 | 500.829 | -623.202 | -3,108.62 |
2022-03-31 | 480.519 | -617.838 | -451.373 |
2021-12-31 | 460.449 | -559.815 | -379.006 |
2021-09-30 | 434.759 | -497.479 | -408.22 |
2021-06-30 | 389.092 | -394.593 | -312.946 |
NVTA's Quality Factors
The “Quality” component of the POWR Ratings focuses on 31 different factors of a companies fundamentals and operational strength. Here are some key insights as we drill into the specifics of these quality attributes.- NVTA has a Quality Grade of D, ranking ahead of 13.88% of graded US stocks.
- NVTA's asset turnover comes in at 0.118 -- ranking 73rd of 81 Healthcare stocks.
- BKD, VCYT, and HCSG are the stocks whose asset turnover ratios are most correlated with NVTA.
The table below shows NVTA's key quality metrics over time.
Period | Asset Turnover | Gross Margin | ROIC |
---|---|---|---|
2021-06-30 | 0.118 | 0.281 | -0.331 |
2021-03-31 | 0.139 | 0.268 | -0.887 |
2020-12-31 | 0.183 | 0.291 | -1.070 |
2020-09-30 | 0.284 | 0.321 | -0.721 |
2020-06-30 | 0.280 | 0.347 | -0.790 |
2020-03-31 | 0.336 | 0.429 | -0.705 |
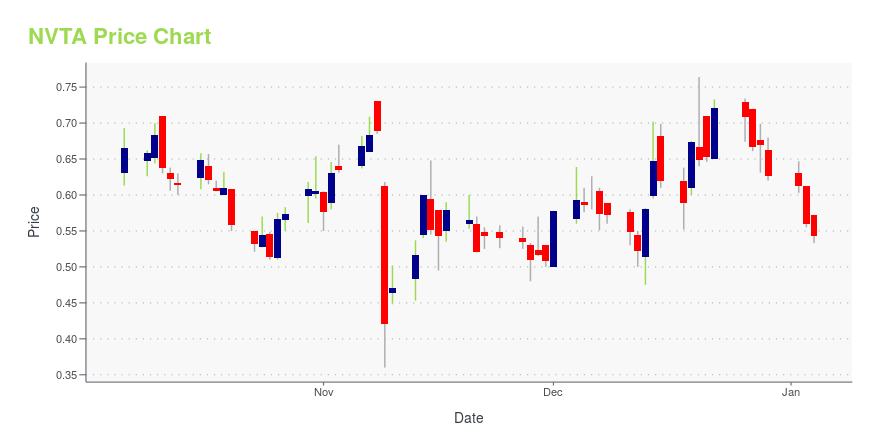
NVTA Stock Price Chart Interactive Chart >
NVTA Price/Volume Stats
Current price | $2.54 | 52-week high | $12.04 |
Prev. close | $2.46 | 52-week low | $1.67 |
Day low | $2.41 | Volume | 8,224,400 |
Day high | $2.62 | Avg. volume | 8,008,061 |
50-day MA | $2.39 | Dividend yield | N/A |
200-day MA | $3.05 | Market Cap | 616.96M |
Invitae Corporation (NVTA) Company Bio
Invitae Corporation is a company that utilizes an integrated portfolio of laboratory processes, software tools and informatics capabilities to process deoxyribonucleic acid (DNA)-containing samples, analyze information about patient-specific genetic variation and generate test reports for physicians and their patients. The company was founded in 2012 and is based in San Francisco, California.
Latest NVTA News From Around the Web
Below are the latest news stories about INVITAE CORP that investors may wish to consider to help them evaluate NVTA as an investment opportunity.
Pre-Market Steady Movements: Avenue Therapeutics, Inc. (NASDAQ:ATXI -21.11%), Invitae Corporation (NYSE:NVTA -2.27%)There are two main reasons why moving averages are useful in forex trading: moving averages help traders define trend recognize changes in trend. Now well have a look on, SMA50 … The post Pre-Market Steady Movements: Avenue Therapeutics, Inc. (NASDAQ:ATXI -21.11%), Invitae Corporation (NYSE:NVTA -2.27%) appeared first on Stocks Equity . |
Cathie Wood Goes Bargain Hunting: 3 Stocks She Just BoughtThe popular growth investor publishes her daily transactions. She keeps buying Tesla as well as some low-priced genetics specialists. |
Do The Numbers Tell The Whole Story? Invitae Corporation (NYSE:NVTA) Is in green zone with the indicator reading 5.27%(NVTA) Constructed a change of 5.27% (Gain, ↑) in a total of its share price and finished it’s trading at 2.78. Invitae Corporation, belongs to Healthcare sector and Diagnostics & Research industry. The company’s … The post Do The Numbers Tell The Whole Story? Invitae Corporation (NYSE:NVTA) Is in green zone with the indicator reading 5.27% appeared first on Stocks Equity . |
Charming stocks: Walgreens Boots Alliance, Inc. (NASDAQ:WBA -1.22%), Invitae Corporation (NYSE:NVTA 5.60%)WBA has seen its SMA50 which is now -7.13%. In looking the SMA 200 we see that the stock has seen a -7.17%. NVTA has seen its SMA50 which is … The post Charming stocks: Walgreens Boots Alliance, Inc. (NASDAQ:WBA -1.22%), Invitae Corporation (NYSE:NVTA 5.60%) appeared first on Stocks Equity . |
Observations on the Invitae Corporation (NYSE:NVTA) Growth CurveInvitae Corporation (NVTA)’s stock has witnessed a price hike of 2.80% from the previous close with its current price standing at $2.57. Its current price is -79.76% under its 52-week high of $12.70 and 53.89% more than its 52-week low of $1.67. Based on the past 30-day period, the stock price is -0.81% below the […] |
NVTA Price Returns
1-mo | 39.56% |
3-mo | 7.63% |
6-mo | 29.59% |
1-year | -75.15% |
3-year | -87.31% |
5-year | -64.67% |
YTD | 36.56% |
2022 | -87.82% |
2021 | -63.48% |
2020 | 159.21% |
2019 | 45.84% |
2018 | 21.81% |
Continue Researching NVTA
Want to do more research on Invitae Corp's stock and its price? Try the links below:Invitae Corp (NVTA) Stock Price | Nasdaq
Invitae Corp (NVTA) Stock Quote, History and News - Yahoo Finance
Invitae Corp (NVTA) Stock Price and Basic Information | MarketWatch
Loading social stream, please wait...