
Oblong, Inc. (OBLG): Price and Financial Metrics
OBLG Price/Volume Stats
| Current price | $0.13 | 52-week high | $2.57 |
| Prev. close | $0.13 | 52-week low | $0.11 |
| Day low | $0.13 | Volume | 777,000 |
| Day high | $0.14 | Avg. volume | 2,230,895 |
| 50-day MA | $0.15 | Dividend yield | N/A |
| 200-day MA | $0.40 | Market Cap | 2.60M |
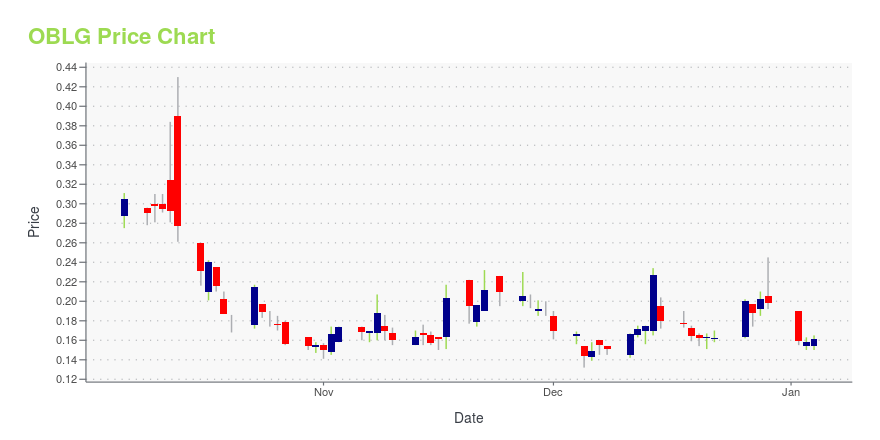
OBLG Stock Price Chart Interactive Chart >
Oblong, Inc. (OBLG) Company Bio
Oblong, Inc. provides video communication software solutions. The Company offers multiple streams sharing, common meeting tools, and wireless voice solutions. Oblong serves customers worldwide.
Latest OBLG News From Around the Web
Below are the latest news stories about OBLONG INC that investors may wish to consider to help them evaluate OBLG as an investment opportunity.
Today’s Biggest Pre-Market Stock Movers: 10 Top Gainers and Losers on ThursdayIt's time to start off Thursday with a breakdown of the biggest pre-market stock movers worth keeping an eye on this morning! |
Oblong Announces Financial Results for Third Quarter 2023 and Provides Business UpdateLOS ANGELES, November 14, 2023--Oblong, Inc. (Nasdaq: OBLG) ("Oblong" or the "Company"), a burgeoning player in the technology sector, is pleased to announce significant strategic shifts and a reinforced commitment to sustainable growth. Over the past year, we believe the Company has diligently optimized its operations, enhanced efficiency, and streamlined expenditures to position itself as a lean and agile innovator in the tech landscape. |
Oblong Appoints Two New Directors to its BoardLOS ANGELES, May 30, 2023--Oblong, Inc. (Nasdaq: OBLG) ("Oblong" or the "Company"), the award-winning maker of multi-stream collaboration solutions, today appointed two new directors to its board. Jonathan Schechter, Partner, The Special Equities Group, and Robert Weinstein, Chief Financial Officer, Synaptogenix, Inc. have joined Oblong’s board of directors. In addition, Jim Lusk and Matthew Blumberg have retired from the Oblong board. |
Oblong Announces Compliance with Nasdaq Bid Price RequirementLOS ANGELES, January 19, 2023--Oblong, Inc. (Nasdaq: OBLG) ("Oblong" or the "Company"), the award-winning maker of multi-stream collaboration solutions, today announced that the Company received formal notice from The Nasdaq Stock Market LLC ("Nasdaq") that the Company has regained compliance with Nasdaq's minimum bid price requirement set forth in Nasdaq Listing Rule 5550(a)(2). Accordingly, Nasdaq has advised that the matter is now closed. |
Oblong Announces Reverse Stock SplitLOS ANGELES, January 03, 2023--Oblong, Inc. (Nasdaq: OBLG) ("Oblong" or the "Company"), the award-winning maker of multi-stream collaboration solutions, announced today that it has filed an amendment to its certificate of incorporation that will effect a reverse stock split of the Company's issued and outstanding shares of common stock by a ratio of 1-for-15, as approved by the Company’s stockholders at its annual meeting and the Company’s board of directors. The reverse stock split will become |
OBLG Price Returns
| 1-mo | -8.52% |
| 3-mo | -16.13% |
| 6-mo | -39.53% |
| 1-year | -94.94% |
| 3-year | -99.80% |
| 5-year | -99.39% |
| YTD | -34.34% |
| 2023 | -88.78% |
| 2022 | -88.58% |
| 2021 | -79.96% |
| 2020 | 269.78% |
| 2019 | 6.92% |
Loading social stream, please wait...