
Prothena Corporation plc - Ordinary Shares (PRTA): Price and Financial Metrics
PRTA Price/Volume Stats
| Current price | $21.16 | 52-week high | $79.65 |
| Prev. close | $20.57 | 52-week low | $20.42 |
| Day low | $20.42 | Volume | 508,500 |
| Day high | $21.18 | Avg. volume | 770,670 |
| 50-day MA | $26.00 | Dividend yield | N/A |
| 200-day MA | $40.94 | Market Cap | 1.14B |
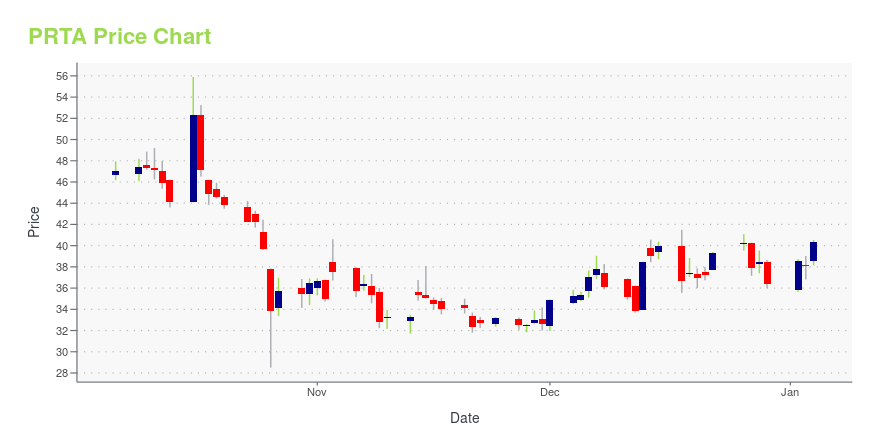
PRTA Stock Price Chart Interactive Chart >
Prothena Corporation plc - Ordinary Shares (PRTA) Company Bio
Prothena Corporation plc is a late-stage clinical biotechnology company focused on the discovery, development and commercialization of novel protein immunotherapy programs for the potential treatment of diseases that involve amyloid or cell adhesion. The company was founded in 2012 and is based in Dublin, Ireland.
Latest PRTA News From Around the Web
Below are the latest news stories about PROTHENA CORP PUBLIC LTD CO that investors may wish to consider to help them evaluate PRTA as an investment opportunity.
Prothena Corp PLC Chief Accounting Officer Sells Company SharesKarin Walker, Chief Accounting Officer of Prothena Corp PLC (NASDAQ:PRTA), sold 5,000 shares of the company on December 20, 2023, according to a recent SEC Filing. |
These 3 Biotech Stocks Have Strong Upside Potential, Says Deutsche BankBiotech is big business, no doubt about that. The healthcare sector takes up almost 1 in 5 dollars of the US gross domestic product, 18.3%, or approximately $13,000 per capita, according to data from the American Medical Association. The total sum is staggering – some $4.3 trillion. The US is the world leader in biomedical research, including innovation on new prescription drugs, medical devices, and other healthcare advances. The health sector R&D spend in the US comes to $250 billion annually. |
The Zacks Analyst Blog Highlights Biogen, Prothena, AC Immune's and VaxxinityBiogen, Prothena, AC Immune's and Vaxxinity are part of the Zacks top Analyst Blog. |
Alzheimer's Disease Space Evolves in 2023: Stocks in FocusThe approval of the breakthrough treatment Leqembi for Alzheimer's Disease has put this space in the spotlight. Companies like ACIU, VAXX and PRTA are in focus, given their experimental vaccines. |
Ligand (LGND) Up 12.4% Since Last Earnings Report: Can It Continue?Ligand (LGND) reported earnings 30 days ago. What's next for the stock? We take a look at earnings estimates for some clues. |
PRTA Price Returns
| 1-mo | -17.31% |
| 3-mo | -35.98% |
| 6-mo | -49.93% |
| 1-year | -61.19% |
| 3-year | -8.87% |
| 5-year | 95.93% |
| YTD | -41.77% |
| 2023 | -39.68% |
| 2022 | 21.96% |
| 2021 | 311.32% |
| 2020 | -24.13% |
| 2019 | 53.69% |
Continue Researching PRTA
Want to do more research on Prothena Corp plc's stock and its price? Try the links below:Prothena Corp plc (PRTA) Stock Price | Nasdaq
Prothena Corp plc (PRTA) Stock Quote, History and News - Yahoo Finance
Prothena Corp plc (PRTA) Stock Price and Basic Information | MarketWatch
Loading social stream, please wait...