
Sandstorm Gold Ltd. Ordinary Shares (Canada) (SAND): Price and Financial Metrics
SAND Price/Volume Stats
| Current price | $5.26 | 52-week high | $6.24 |
| Prev. close | $5.52 | 52-week low | $3.96 |
| Day low | $5.24 | Volume | 2,553,400 |
| Day high | $5.41 | Avg. volume | 2,433,218 |
| 50-day MA | $4.82 | Dividend yield | 0.55% |
| 200-day MA | $4.92 | Market Cap | 1.57B |
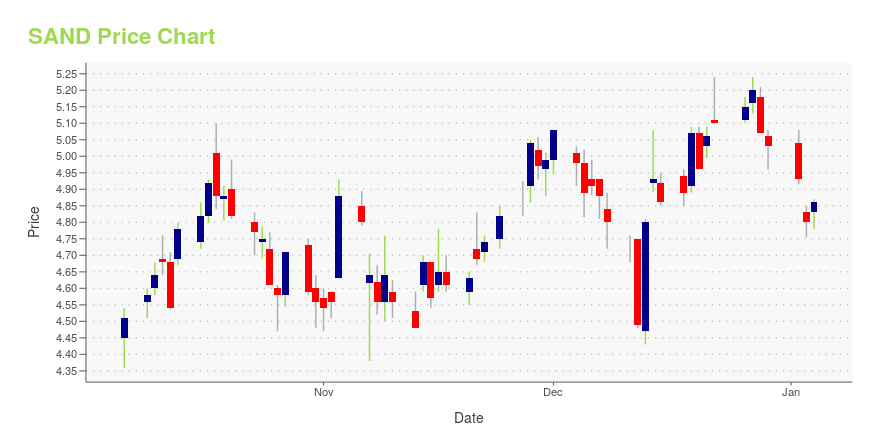
SAND Stock Price Chart Interactive Chart >
Sandstorm Gold Ltd. Ordinary Shares (Canada) (SAND) Company Bio
Sandstorm Gold Ltd. focuses on acquiring gold and other precious metal purchase agreements and royalties from companies that have advanced stage development projects or operating mines. The company was founded in 2007 and is based in Vancouver, Canada.
Latest SAND News From Around the Web
Below are the latest news stories about SANDSTORM GOLD LTD that investors may wish to consider to help them evaluate SAND as an investment opportunity.
3 Gaming Cryptos That Are Worth Playing in 2024Gaming cryptos represent unique upside as the global blockchain gaming market is set to expand massively in coming years. |
Sandstorm Gold (TSE:SSL) Has Affirmed Its Dividend Of $0.02The board of Sandstorm Gold Ltd. ( TSE:SSL ) has announced that it will pay a dividend of $0.02 per share on the 26th... |
Sandstorm Gold Royalties Declares Quarterly Dividend for First Quarter 2024Sandstorm Gold Ltd. ("Sandstorm Gold Royalties", "Sandstorm" or the "Company") (NYSE: SAND) (TSX: SSL) is pleased to announce that its Board of Directors has declared the Company's first quarterly cash dividend for 2024 in the amount of C$0.02 per common share to shareholders of record as of the close of business on January 16, 2024. The dividend will be paid on January 26, 2024. The dividend qualifies as an "eligible dividend" as defined in the Income Tax Act (Canada). |
13 Most Promising Gold Stocks According to AnalystsIn this article, we discuss the 13 most promising gold stocks according to analysts. To skip the detailed analysis of the industry, go directly to the 5 Most Promising Gold Stocks According to Analysts. Gold has started to make noise in the stock and commodity markets again as it recently jumped to a record high. […] |
Calculating The Fair Value Of Sandstorm Gold Ltd. (TSE:SSL)Key Insights The projected fair value for Sandstorm Gold is CA$6.28 based on 2 Stage Free Cash Flow to Equity Sandstorm... |
SAND Price Returns
| 1-mo | 6.26% |
| 3-mo | 12.63% |
| 6-mo | 14.85% |
| 1-year | -9.87% |
| 3-year | -29.67% |
| 5-year | 4.33% |
| YTD | 4.57% |
| 2023 | -3.32% |
| 2022 | -14.28% |
| 2021 | -13.53% |
| 2020 | -3.76% |
| 2019 | 61.60% |
SAND Dividends
| Ex-Dividend Date | Type | Payout Amount | Change | ||||||
|---|---|---|---|---|---|---|---|---|---|
| Loading, please wait... | |||||||||
Continue Researching SAND
Here are a few links from around the web to help you further your research on Sandstorm Gold Ltd's stock as an investment opportunity:Sandstorm Gold Ltd (SAND) Stock Price | Nasdaq
Sandstorm Gold Ltd (SAND) Stock Quote, History and News - Yahoo Finance
Sandstorm Gold Ltd (SAND) Stock Price and Basic Information | MarketWatch
Loading social stream, please wait...