Southside Bancshares, Inc. (SBSI): Price and Financial Metrics
GET POWR RATINGS... FREE!
SBSI POWR Grades
- SBSI scores best on the Stability dimension, with a Stability rank ahead of 90.95% of US stocks.
- SBSI's strongest trending metric is Momentum; it's been moving up over the last 179 days.
- SBSI ranks lowest in Value; there it ranks in the 18th percentile.
SBSI Stock Summary
- Equity multiplier, or assets relative to shareholders' equity, comes in at 8.07 for Southside Bancshares Inc; that's greater than it is for 87.29% of US stocks.
- With a year-over-year growth in debt of -51.97%, Southside Bancshares Inc's debt growth rate surpasses only 6.95% of about US stocks.
- Southside Bancshares Inc's shareholder yield -- a measure of how much capital is returned to stockholders via dividends and buybacks -- is 48.7%, greater than the shareholder yield of 96.91% of stocks in our set.
- Stocks that are quantitatively similar to SBSI, based on their financial statements, market capitalization, and price volatility, are FLIC, PWOD, CZWI, BANC, and BY.
- Visit SBSI's SEC page to see the company's official filings. To visit the company's web site, go to www.southside.com.
SBSI Valuation Summary
- In comparison to the median Financial Services stock, SBSI's price/sales ratio is 300% higher, now standing at 4.8.
- SBSI's EV/EBIT ratio has moved down 20.4 over the prior 243 months.
- Over the past 243 months, SBSI's price/sales ratio has gone up 2.5.
Below are key valuation metrics over time for SBSI.
Stock | Date | P/S | P/B | P/E | EV/EBIT |
---|---|---|---|---|---|
SBSI | 2019-05-28 | 5.5 | 1.5 | 14.7 | 18.8 |
SBSI | 2019-04-18 | 5.6 | 1.6 | 15.4 | 22.9 |
SBSI | 2015-04-13 | 6.0 | 1.7 | 33.8 | 84.7 |
SBSI | 2011-09-15 | 2.6 | 1.3 | 8.6 | 18.5 |
SBSI | 2002-05-15 | 2.8 | 1.9 | 10.6 | 34.1 |
SBSI | 2002-03-15 | 2.4 | 1.6 | 9.2 | 32.3 |
SBSI Growth Metrics
- Its 4 year net income to common stockholders growth rate is now at 24.01%.
- Its 3 year cash and equivalents growth rate is now at 294.34%.
- The 2 year cash and equivalents growth rate now stands at -57.3%.

The table below shows SBSI's growth in key financial areas (numbers in millions of US dollars).
Date | Revenue | Operating Cash Flow | Net Income to Common Stock |
---|---|---|---|
2021-12-31 | 255.857 | 156.104 | 113.401 |
2021-09-30 | 256.176 | 168.919 | 114.286 |
2021-06-30 | 252.603 | 153.27 | 112.054 |
2021-03-31 | 251.919 | 154.834 | 112.291 |
2020-12-31 | 216.796 | 90.52 | 82.153 |
2020-09-30 | 202.777 | 70.903 | 69.916 |
SBSI's Quality Factors
The “Quality” component of the POWR Ratings focuses on 31 different factors of a companies fundamentals and operational strength. Here are some key insights as we drill into the specifics of these quality attributes.- SBSI has a Quality Grade of C, ranking ahead of 42.25% of graded US stocks.
- SBSI's asset turnover comes in at 0.036 -- ranking 258th of 430 Banking stocks.
- TBK, MRLN, and CNNB are the stocks whose asset turnover ratios are most correlated with SBSI.
The table below shows SBSI's key quality metrics over time.
Period | Asset Turnover | Gross Margin | ROIC |
---|---|---|---|
2021-09-30 | 0.036 | 1 | 0.017 |
2021-06-30 | 0.036 | 1 | 0.016 |
2021-03-31 | 0.035 | 1 | 0.016 |
2020-12-31 | 0.030 | 1 | 0.011 |
2020-09-30 | 0.028 | 1 | 0.010 |
2020-06-30 | 0.028 | 1 | 0.009 |
SBSI Price Target
For more insight on analysts targets of SBSI, see our SBSI price target page. And for a list of of all stocks sorted by upside potential based on analyst target price, see our Top Price Target page.
Average Price Target | $39.25 | Average Broker Recommendation | 2 (Hold) |
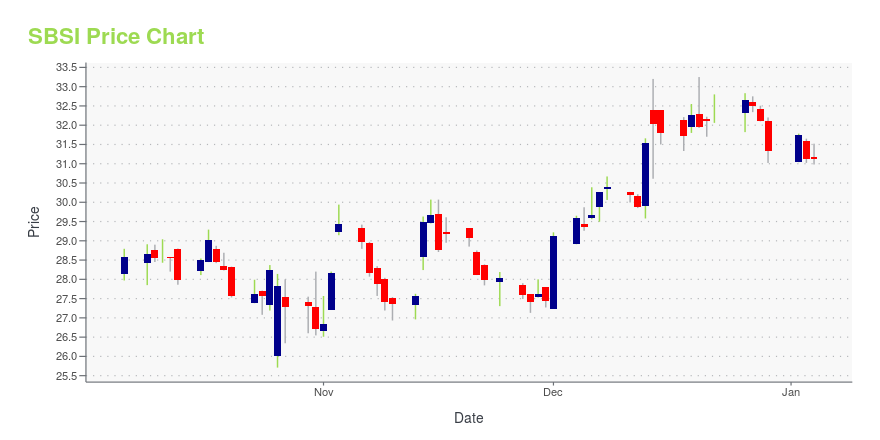
SBSI Stock Price Chart Interactive Chart >
SBSI Price/Volume Stats
Current price | $37.14 | 52-week high | $45.36 |
Prev. close | $36.42 | 52-week low | $34.52 |
Day low | $36.47 | Volume | 308,400 |
Day high | $37.15 | Avg. volume | 100,047 |
50-day MA | $38.93 | Dividend yield | 3.66% |
200-day MA | $40.58 | Market Cap | 1.19B |
Southside Bancshares, Inc. (SBSI) Company Bio
Southside Bancshares, Inc. provides financial products and services to individuals, businesses, municipal entities, and nonprofit organizations in Texas. The company was founded in 1960 and is based in Tyler, Texas.
Latest SBSI News From Around the Web
Below are the latest news stories about Southside Bancshares Inc that investors may wish to consider to help them evaluate SBSI as an investment opportunity.
Southside Bancshares, Inc. (SBSI) Investor Presentation - SlideshowNo summary available. |
First Dallas Securities Inc. Buys American Eagle Outfitters Inc, Ethan Allen Interiors Inc, New ...Dallas, TX, based Investment company First Dallas Securities Inc. (Current Portfolio) buys American Eagle Outfitters Inc, Ethan Allen Interiors Inc, New York Community Bancorp Inc, PayPal Holdings Inc, Pioneer Natural Resources Co, sells GoodRx Holdings Inc, Deutsche Bank AG, Encore Wire Corp, Nordstrom Inc, AT&T Inc during the 3-months ended 2021Q4, according to the most recent filings of the investment company, First Dallas Securities Inc.. |
Hamilton Point Investment Advisors, LLC Buys Paychex Inc, Leggett & Platt Inc, Southside ...Chapel Hill, NC, based Investment company Hamilton Point Investment Advisors, LLC (Current Portfolio) buys Paychex Inc, Leggett & Platt Inc, Southside Bancshares Inc, Truist Financial Corp, Pathfinder Bancorp Inc, sells Campbell Soup Co, AT&T Inc, PayPal Holdings Inc, Stryker Corp during the 3-months ended 2021Q4, according to the most recent filings of the investment company, Hamilton Point Investment Advisors, LLC. |
Southside: Growing TX BankOverview Southside Bancshares (SBSI) is a Tyler, TX-based Community-focused financial institution. The bank offers a broad range of consumer, commercial, and mortgage banking services as well as private banking and wealth management products. Southside has a diversified footprint consisting of 55 branches, among which 13 are located in grocery stores.... |
Southside Bancshares raises dividend by 3% to $0.34Southside Bancshares (NASDAQ:SBSI) declares $0.34/share quarterly dividend, 3% increase from prior dividend of $0.33.Forward yield 3.26%Payable March 3; for shareholders of record Feb. |
SBSI Price Returns
1-mo | -7.63% |
3-mo | -9.07% |
6-mo | -9.69% |
1-year | -4.22% |
3-year | 29.56% |
5-year | 31.34% |
YTD | -9.71% |
2021 | 39.55% |
2020 | -12.74% |
2019 | 21.32% |
2018 | -2.40% |
2017 | -7.69% |
SBSI Dividends
Ex-Dividend Date | Type | Payout Amount | Change | ||||||
---|---|---|---|---|---|---|---|---|---|
Loading, please wait... |
Continue Researching SBSI
Want to see what other sources are saying about Southside Bancshares Inc's financials and stock price? Try the links below:Southside Bancshares Inc (SBSI) Stock Price | Nasdaq
Southside Bancshares Inc (SBSI) Stock Quote, History and News - Yahoo Finance
Southside Bancshares Inc (SBSI) Stock Price and Basic Information | MarketWatch
Loading social stream, please wait...