
Scientific Games Corp (SGMS): Price and Financial Metrics
SGMS Price/Volume Stats
| Current price | $58.07 | 52-week high | $90.20 |
| Prev. close | $56.75 | 52-week low | $50.72 |
| Day low | $55.66 | Volume | 515,600 |
| Day high | $58.60 | Avg. volume | 786,636 |
| 50-day MA | $59.92 | Dividend yield | N/A |
| 200-day MA | $66.95 | Market Cap | 5.61B |
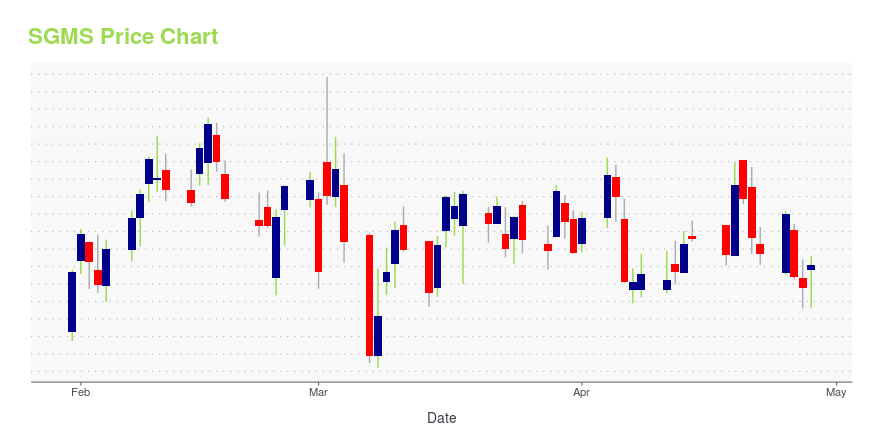
SGMS Stock Price Chart Interactive Chart >
Scientific Games Corp (SGMS) Company Bio
Scientific Games Corporation develops technology-based products and services, and associated content for the gaming and lottery industries worldwide. The company was founded in 1984 and is based in Las Vegas, Nevada.
Latest SGMS News From Around the Web
Below are the latest news stories about Scientific Games Corp that investors may wish to consider to help them evaluate SGMS as an investment opportunity.
Perficient (PRFT) Tops Q4 Earnings and Revenue EstimatesPerficient (PRFT) delivered earnings and revenue surprises of 7.53% and 3.53%, respectively, for the quarter ended December 2021. Do the numbers hold clues to what lies ahead for the stock? |
Scientific Games International, Inc. -- Moody's announces completion of a periodic review of ratings of Scientific Games International, Inc.Announcement of Periodic Review: Moody's announces completion of a periodic review of ratings of Scientific Games International, Inc.Global Credit Research - 24 Feb 2022New York, February 24, 2022 -- Moody's Investors Service ("Moody's") has completed a periodic review of the ratings of Scientific Games International, Inc. and other ratings that are associated with the same analytical unit. The review was conducted through a portfolio review discussion held on 16 February 2022 in which Moody's reassessed the appropriateness of the ratings in the context of the relevant principal methodology(ies), recent developments, and a comparison of the financial and operating profile to similarly rated peers. Since 1 January 2019, Moody's practice has been to issue a press release following each ... |
ManTech International (MANT) Beats Q4 Earnings EstimatesManTech (MANT) delivered earnings and revenue surprises of 3.75% and 1%, respectively, for the quarter ended December 2021. Do the numbers hold clues to what lies ahead for the stock? |
SciPlay: Cards Are Not Dealt RightSciPlay (SCPL) is an interesting name to cover here, with M&A activity across the gaming sector being a hot issue. This and the pandemic period makes it much needed to update a dated thesis, going back to the summer of 2020. In the summer of 2020, I concluded that I... |
Scientific Games Stock Scores Rising Relative StrengthScientific Games shows rising price performance, earning an upgrade to its IBD Relative Strength Rating from 67 to 81. |
SGMS Price Returns
| 1-mo | N/A |
| 3-mo | N/A |
| 6-mo | N/A |
| 1-year | N/A |
| 3-year | 30.85% |
| 5-year | 156.04% |
| YTD | N/A |
| 2023 | N/A |
| 2022 | 0.00% |
| 2021 | 61.07% |
| 2020 | 54.93% |
| 2019 | 49.78% |
Continue Researching SGMS
Here are a few links from around the web to help you further your research on Scientific Games Corp's stock as an investment opportunity:Scientific Games Corp (SGMS) Stock Price | Nasdaq
Scientific Games Corp (SGMS) Stock Quote, History and News - Yahoo Finance
Scientific Games Corp (SGMS) Stock Price and Basic Information | MarketWatch
Loading social stream, please wait...