Silicom Ltd - Ordinary Shares (SILC): Price and Financial Metrics
GET POWR RATINGS... FREE!
SILC POWR Grades
- Sentiment is the dimension where SILC ranks best; there it ranks ahead of 99.08% of US stocks.
- SILC's strongest trending metric is Stability; it's been moving down over the last 177 days.
- SILC's current lowest rank is in the Quality metric (where it is better than 44.25% of US stocks).
SILC Stock Summary
- Of note is the ratio of SILICOM LTD's sales and general administrative expense to its total operating expenses; just 17.22% of US stocks have a lower such ratio.
- With a year-over-year growth in debt of -14.67%, SILICOM LTD's debt growth rate surpasses merely 18.59% of about US stocks.
- Over the past twelve months, SILC has reported earnings growth of 73.5%, putting it ahead of 82.87% of US stocks in our set.
- Stocks with similar financial metrics, market capitalization, and price volatility to SILICOM LTD are FULC, VYGR, RXRX, FUSN, and IMGN.
- SILC's SEC filings can be seen here. And to visit SILICOM LTD's official web site, go to www.silicom-usa.com.
SILC Valuation Summary
- In comparison to the median Technology stock, SILC's price/sales ratio is 20.83% lower, now standing at 1.9.
- Over the past 243 months, SILC's price/sales ratio has gone up 1.4.
Below are key valuation metrics over time for SILC.
Stock | Date | P/S | P/B | P/E | EV/EBIT |
---|---|---|---|---|---|
SILC | 2023-03-21 | 1.9 | 1.6 | 15.3 | 11.5 |
SILC | 2023-03-20 | 1.8 | 1.5 | 15.1 | 11.3 |
SILC | 2023-03-17 | 1.8 | 1.5 | 14.9 | 11.1 |
SILC | 2023-03-16 | 1.8 | 1.6 | 15.2 | 11.4 |
SILC | 2023-03-15 | 1.8 | 1.5 | 14.9 | 11.2 |
SILC | 2023-03-14 | 1.8 | 1.5 | 15.1 | 11.3 |
SILC Growth Metrics
- Its 3 year cash and equivalents growth rate is now at 38.2%.
- Its 5 year revenue growth rate is now at 7.03%.
- The 2 year revenue growth rate now stands at -19.7%.

The table below shows SILC's growth in key financial areas (numbers in millions of US dollars).
Date | Revenue | Operating Cash Flow | Net Income to Common Stock |
---|---|---|---|
2020-12-31 | 107.398 | 4.956 | 5.725 |
2019-12-31 | 105.24 | 26.726 | 10.236 |
2018-12-31 | 133.753 | 45.678 | 14.637 |
2017-12-31 | 125.69 | 1.408 | 21.714 |
2016-12-31 | 100.347 | -2.707 | 13.137 |
SILC's Quality Factors
The “Quality” component of the POWR Ratings focuses on 31 different factors of a companies fundamentals and operational strength. Here are some key insights as we drill into the specifics of these quality attributes.- SILC has a Quality Grade of C, ranking ahead of 36.01% of graded US stocks.
- SILC's asset turnover comes in at 0.549 -- ranking 52nd of 83 Computers stocks.
- 500 - Internal server error
The table below shows SILC's key quality metrics over time.
Period | Asset Turnover | Gross Margin | ROIC |
---|---|---|---|
2020-12-31 | 0.549 | 0.314 | 0.056 |
2019-12-31 | 0.558 | 0.343 | 0.100 |
2018-12-31 | 0.776 | 0.314 | 0.170 |
2017-12-31 | 0.813 | 0.365 | 0.272 |
2016-12-31 | 0.701 | 0.384 | 0.199 |
2015-12-31 | 0.631 | 0.412 | 0.259 |
SILC Price Target
For more insight on analysts targets of SILC, see our SILC price target page. And for a list of of all stocks sorted by upside potential based on analyst target price, see our Top Price Target page.
Average Price Target | $57.00 | Average Broker Recommendation | 1.5 (Moderate Buy) |
SILC Stock Price Chart Interactive Chart >
SILC Price/Volume Stats
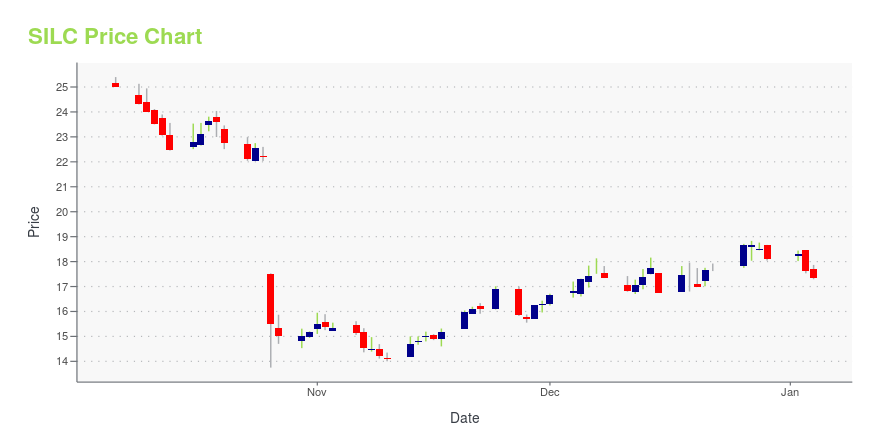
Current price | $36.80 | 52-week high | $50.00 |
Prev. close | $36.90 | 52-week low | $31.30 |
Day low | $36.65 | Volume | 3,500 |
Day high | $37.13 | Avg. volume | 20,214 |
50-day MA | $40.13 | Dividend yield | N/A |
200-day MA | $39.65 | Market Cap | 244.76M |
Silicom Ltd - Ordinary Shares (SILC) Company Bio
Silicom Ltd. designs, manufactures, markets, and supports networking and data infrastructure solutions for a range of servers, server based systems, and communications devices in North America, Europe, and the Asia Pacific. The company was founded in 1987 and is based in Kfar Sava, Israel.
Latest SILC News From Around the Web
Below are the latest news stories about SILICOM LTD that investors may wish to consider to help them evaluate SILC as an investment opportunity.
Silicom (NASDAQ:SILC) shareholders have earned a 10% CAGR over the last three yearsSilicom Ltd. ( NASDAQ:SILC ) shareholders might be concerned after seeing the share price drop 12% in the last quarter... |
Leading SASE Player Selects Silicom's Edge Networking Product for its Next Generation OfferingSilicom Ltd. (NASDAQ: SILC), a leading provider of networking and data infrastructure solutions, today announced that it has secured another Design Win for one of its pioneering Edge Networking products. The customer, a leading Secure Access Service Edge (SASE) vendor, has already placed an initial deployment order that will be delivered by Silicom during the first half of 2023. In addition, Silicom and the customer are working together on a wireless Edge Networking solution that will support ad |
Silicom Reports Continued Edge Networking Momentum: Design Win With Leading Provider of IP Voice SolutionsSilicom Ltd. (NASDAQ: SILC), a leading provider of networking and data infrastructure solutions, today announced that it has secured its first Design Win with a leading provider of enterprise voice solutions. The win is for a customized edge compute board that the customer will integrate into one of its advanced uCPE platforms to provide important additional functionality, including support for virtual network functions. |
Silicom Ltd. (NASDAQ:SILC) Q4 2022 Earnings Call TranscriptSilicom Ltd. (NASDAQ:SILC) Q4 2022 Earnings Call Transcript January 30, 2023 Operator: Ladies and gentlemen, thank you for standing by. Welcome to the Silicom Fourth Quarter 2022 Results Conference Call. All participants are at present in listen-only mode. Following management’s formal presentation, instructions will be given for the question-and-answer session. As a reminder, this conference […] |
Silicom Beats On Q4 Earnings, Issues Inline Q1 Revenue OutlookSilicom Ltd (NASDAQ: SILC) reported fourth-quarter FY22 revenue growth of 24% year-on-year to $45.19 million, beating the analyst consensus of $43.74 million. Non-GAAP EPS of $0.98 beat the analyst consensus of $0.96. The non-GAAP gross margin decreased 137 bps to 33.5%, and the non-GAAP operating margin expanded 345 bps to 17.6%. Silicom held $34.8 million in cash and equivalents. Liron Eizenman, Silicom's President and CEO, commented, "In fact, we have entered 2023 with our highest-ever year-s |
SILC Price Returns
1-mo | -3.54% |
3-mo | -9.69% |
6-mo | 7.07% |
1-year | -7.65% |
3-year | 36.20% |
5-year | 6.95% |
YTD | -12.69% |
2022 | -18.31% |
2021 | 23.30% |
2020 | 25.83% |
2019 | -4.81% |
2018 | -50.16% |
Continue Researching SILC
Want to see what other sources are saying about Silicom Ltd's financials and stock price? Try the links below:Silicom Ltd (SILC) Stock Price | Nasdaq
Silicom Ltd (SILC) Stock Quote, History and News - Yahoo Finance
Silicom Ltd (SILC) Stock Price and Basic Information | MarketWatch
Loading social stream, please wait...